Open Access
Fig. 3
Download original image
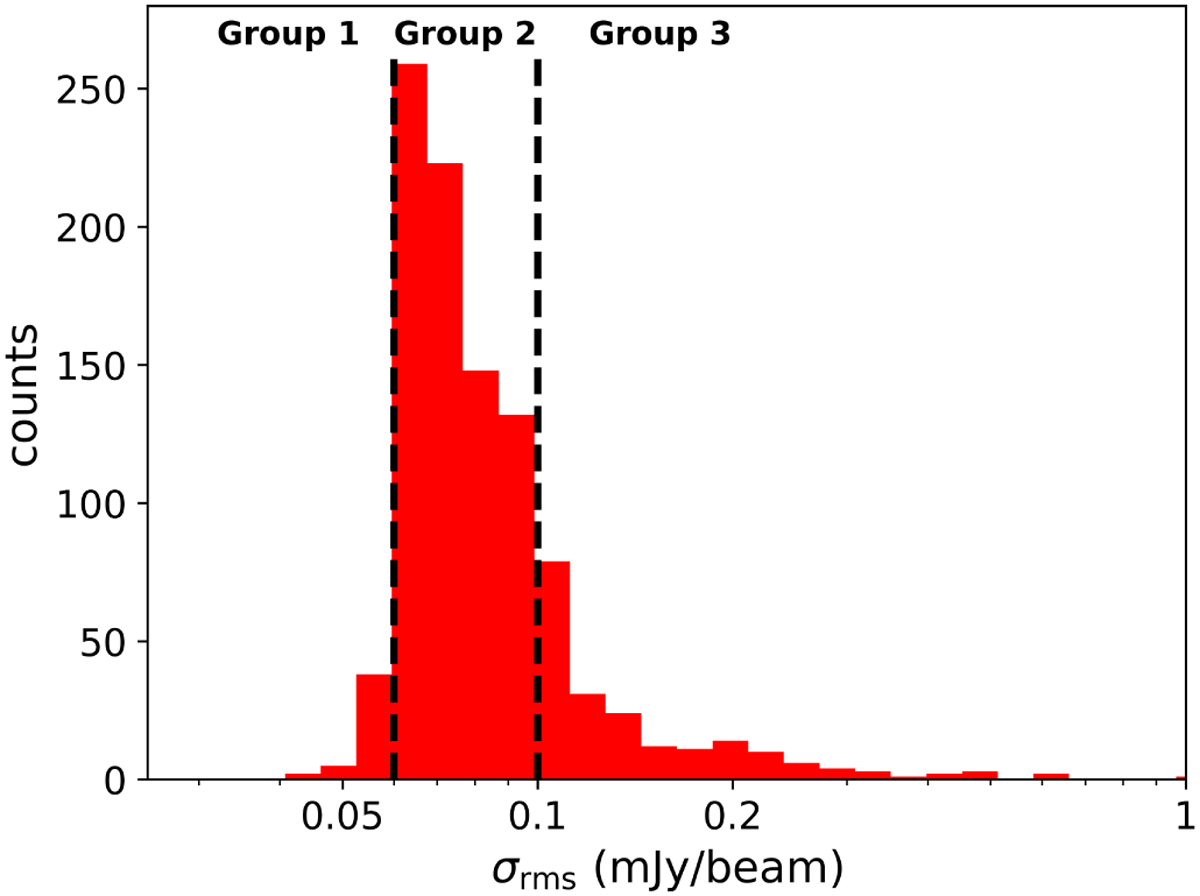
Distribution of the map rms noise level σrms across the ALMA- GAL maps sample (see Sánchez-Monge et al. 2025 for more details). The vertical dashed lines mark the subdivision into the three reported groups of fields that are employed in Sect. 3.3.
Current usage metrics show cumulative count of Article Views (full-text article views including HTML views, PDF and ePub downloads, according to the available data) and Abstracts Views on Vision4Press platform.
Data correspond to usage on the plateform after 2015. The current usage metrics is available 48-96 hours after online publication and is updated daily on week days.
Initial download of the metrics may take a while.