Fig. C.1
Download original image
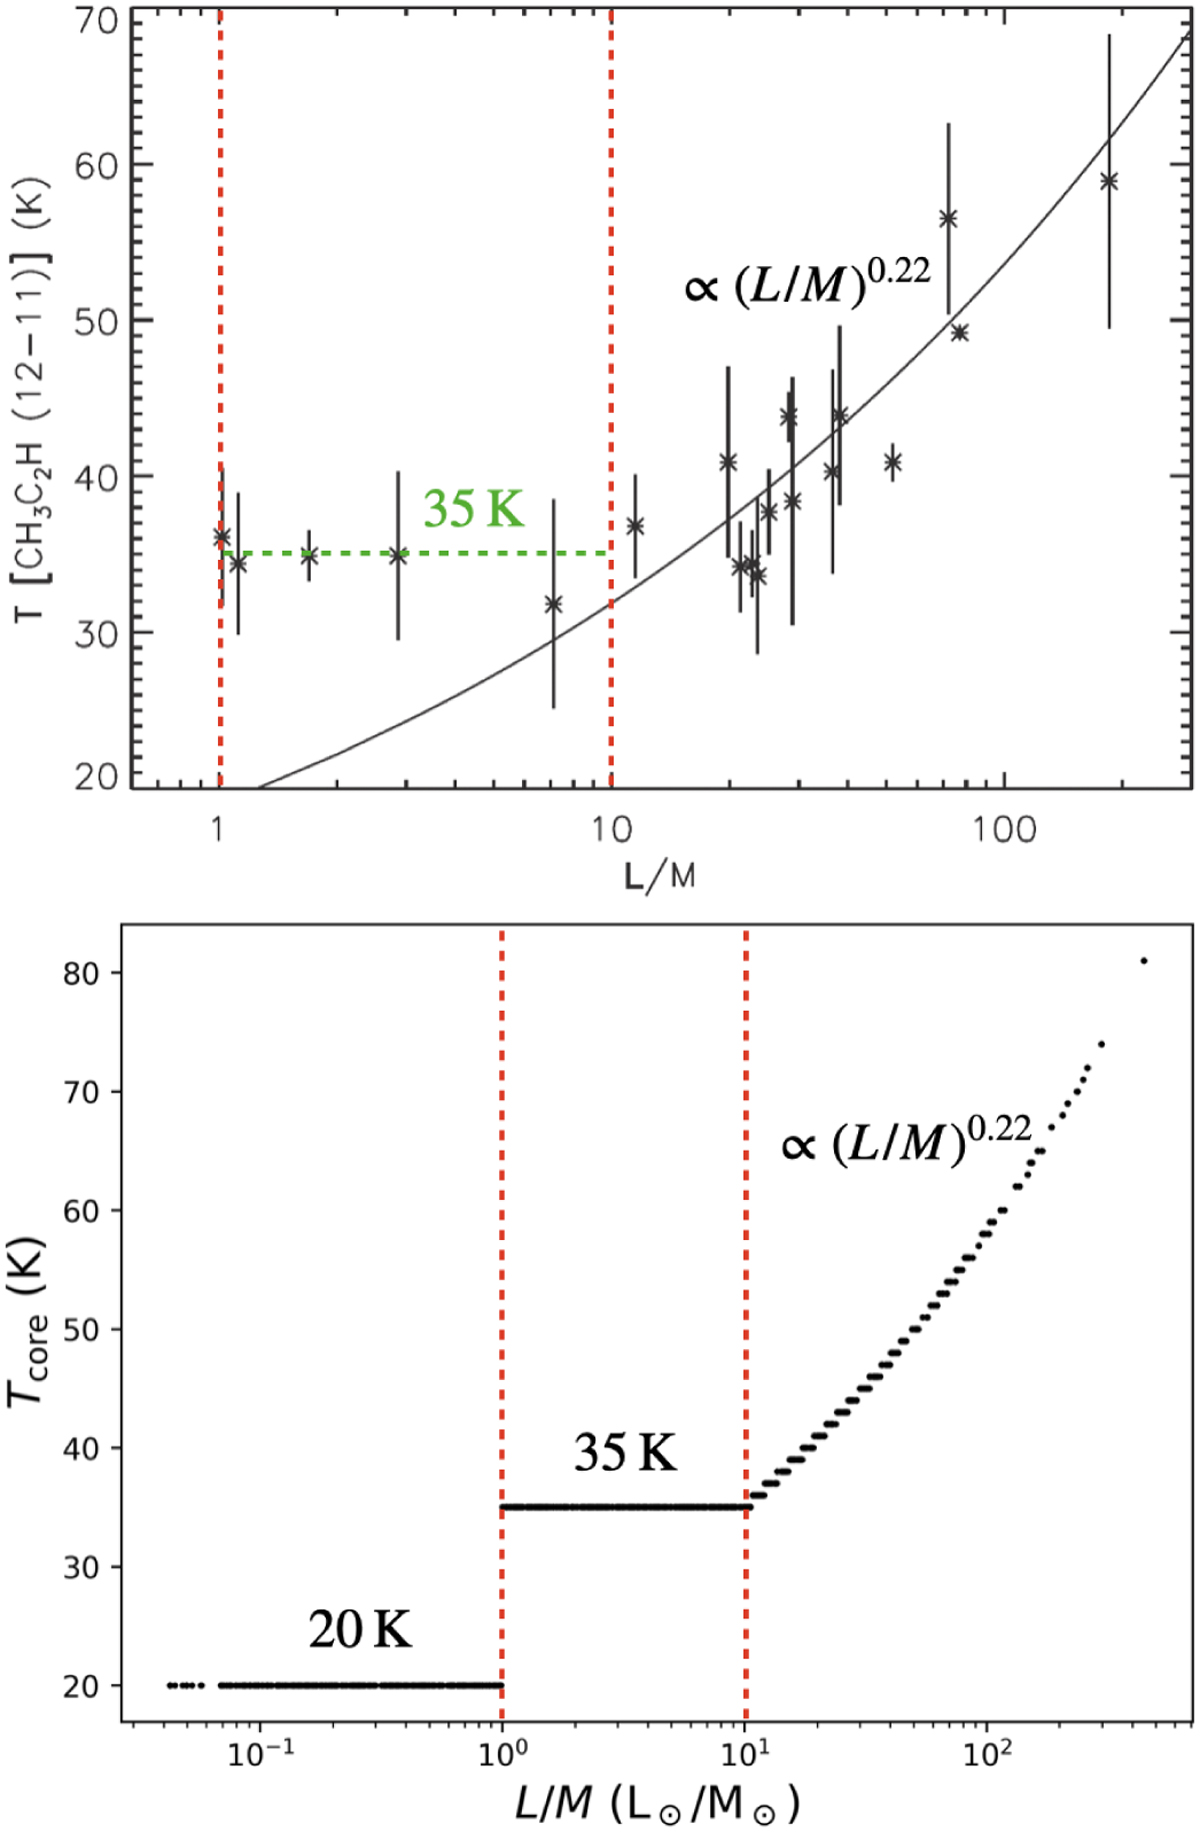
Details of the temperature model adopted for the cores. Top panel: Calibration of the clump L/M with the rotational temperature of CH3C2H, edited from Molinari et al. (2016a). The vertical dashed red lines mark different ranges of L/M as done in our work. The horizontal dashed green line mark the 35 K temperature value fitting the point within the 1 − 10 L⊙/M⊙ range, which has been adopted in this work for the correspondent evolutionary group. The full black line represents the power law fitting the points at L/M > 10L⊙/M⊙ (see Molinari et al. 2016a), also adopted in this work. Bottom panel: Overall distribution of the assumed core temperatures as a function of the clump L/M, resulting from the model used in this work. The vertical dashed red lines serve as in the top panel.
Current usage metrics show cumulative count of Article Views (full-text article views including HTML views, PDF and ePub downloads, according to the available data) and Abstracts Views on Vision4Press platform.
Data correspond to usage on the plateform after 2015. The current usage metrics is available 48-96 hours after online publication and is updated daily on week days.
Initial download of the metrics may take a while.