Fig. 20
Download original image
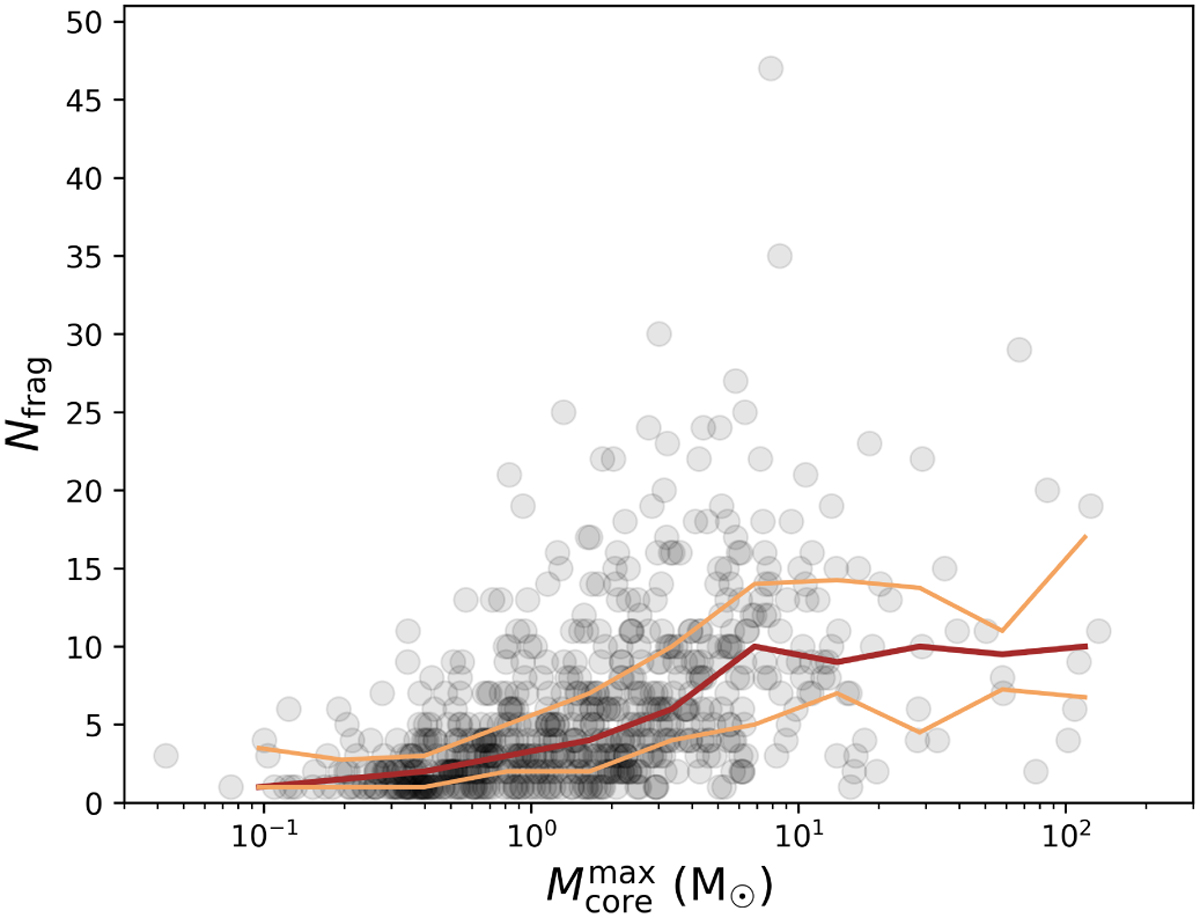
Number of detected compact fragments (cores) as a function of ![]() for each clump. Points are drawn in transparency to highlight the local density of the data. The solid brown line draws the trend of the median Nfrag in given bins of
for each clump. Points are drawn in transparency to highlight the local density of the data. The solid brown line draws the trend of the median Nfrag in given bins of ![]() . The solid lighter brown lines correspond to the 25th (bottom) and 75th (top) percentiles of the Nfrag distribution within the same bins.
. The solid lighter brown lines correspond to the 25th (bottom) and 75th (top) percentiles of the Nfrag distribution within the same bins.
Current usage metrics show cumulative count of Article Views (full-text article views including HTML views, PDF and ePub downloads, according to the available data) and Abstracts Views on Vision4Press platform.
Data correspond to usage on the plateform after 2015. The current usage metrics is available 48-96 hours after online publication and is updated daily on week days.
Initial download of the metrics may take a while.