Fig. 17
Download original image
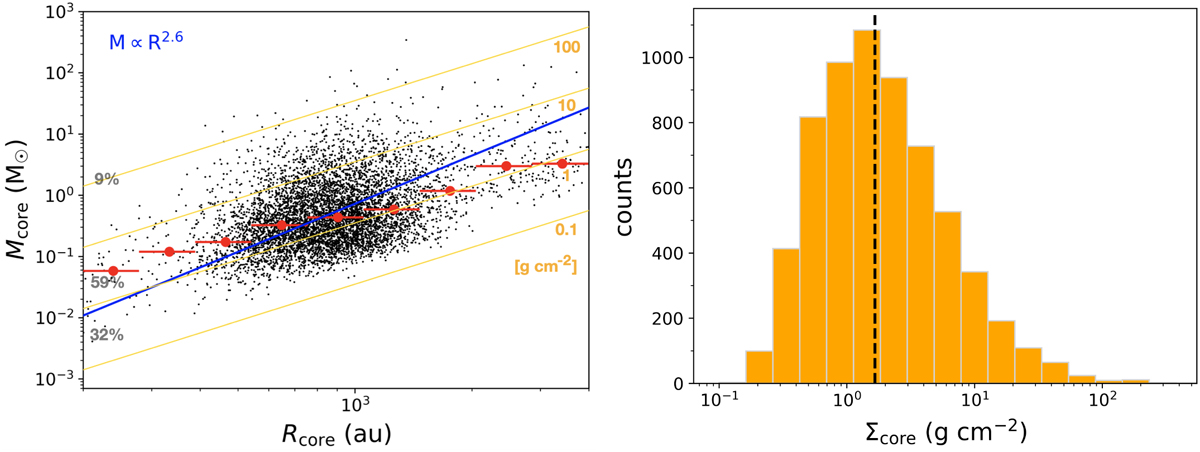
Mass–radius relation and mass surface density distribution for the core sample. Left panel: core masses as a function of estimated radius. Solid gold lines represent different values of core surface density: from bottom to top, 0.1, 1, 10, and 100 g cm−2, respectively. Percentages of data points within the corresponding bins of surface density are given in grey. Red points indicate the median Mcore values in given bins (red bars) of Rcore . The solid blue line is the best fit to the data points, corresponding to the power-law relation reported in the top-left corner. Right panel: distribution of the mass surface density of the cores. The vertical dashed black line marks the median value of 1.7 g cm−2.
Current usage metrics show cumulative count of Article Views (full-text article views including HTML views, PDF and ePub downloads, according to the available data) and Abstracts Views on Vision4Press platform.
Data correspond to usage on the plateform after 2015. The current usage metrics is available 48-96 hours after online publication and is updated daily on week days.
Initial download of the metrics may take a while.