Open Access
Fig. 15
Download original image
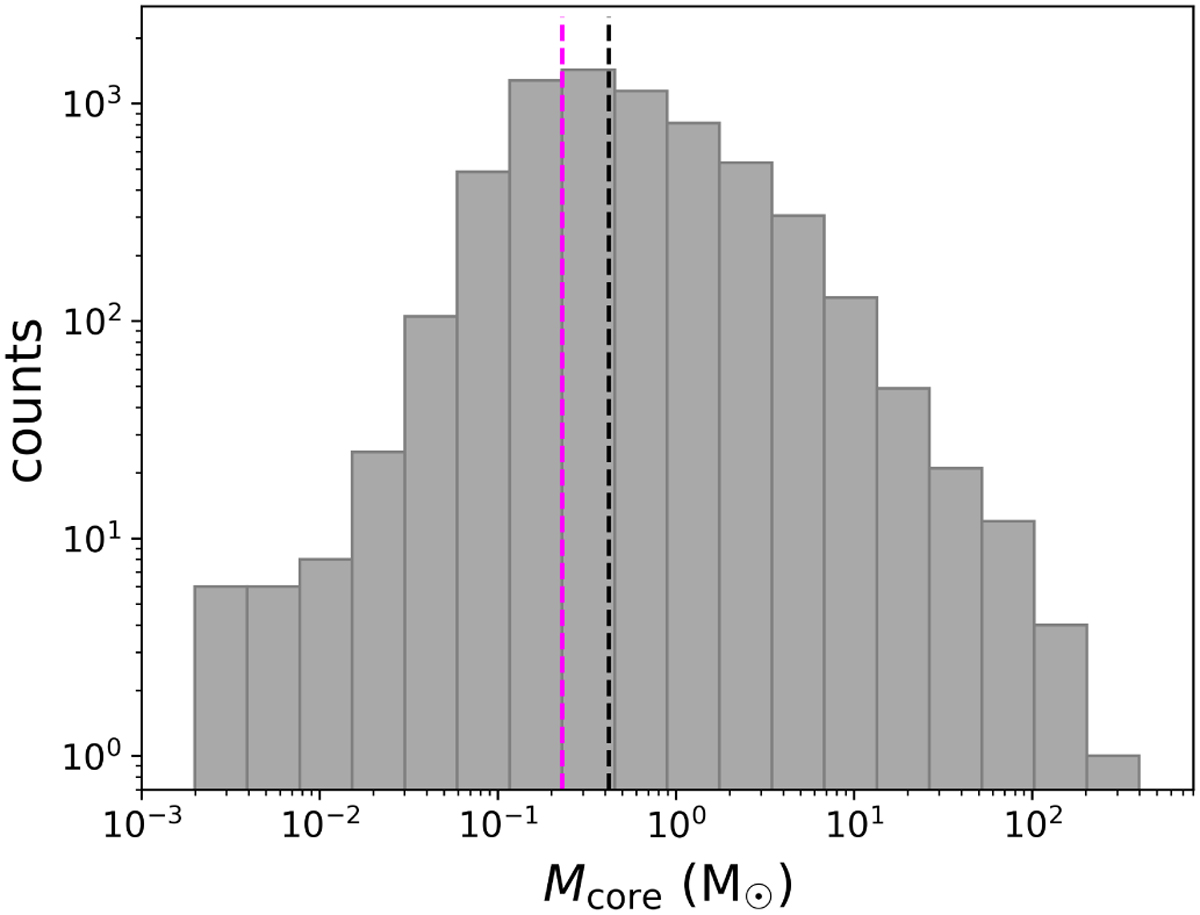
Overall distribution of the estimated core masses. The vertical dashed magenta line marks the average mass completeness limit of 0.23 M⊙ estimated for our sample (see Sect. 5.2.4), while the vertical dashed black lines marks the median value of the distribution (0.4 M⊙).
Current usage metrics show cumulative count of Article Views (full-text article views including HTML views, PDF and ePub downloads, according to the available data) and Abstracts Views on Vision4Press platform.
Data correspond to usage on the plateform after 2015. The current usage metrics is available 48-96 hours after online publication and is updated daily on week days.
Initial download of the metrics may take a while.