Fig. 12
Download original image
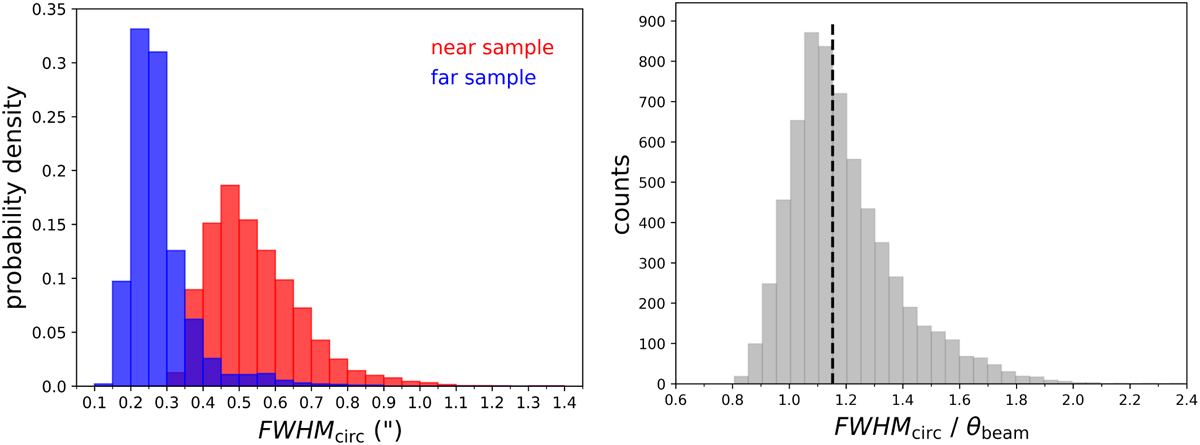
Angular sizes of the extracted sources. Left panel: probability density distribution of the circularized FWHM of the sources. Red and blue bars include sources detected within the near sample and the far sample targets, respectively (see Sect. 2). Right panel: distribution of the ratio between the estimated angular size of the source and the map beam size (both in circularized form), providing a resolution-independent estimate of the source sizes. The vertical dashed black line marks the median value of 1.15 for the ratio.
Current usage metrics show cumulative count of Article Views (full-text article views including HTML views, PDF and ePub downloads, according to the available data) and Abstracts Views on Vision4Press platform.
Data correspond to usage on the plateform after 2015. The current usage metrics is available 48-96 hours after online publication and is updated daily on week days.
Initial download of the metrics may take a while.