Fig. 10
Download original image
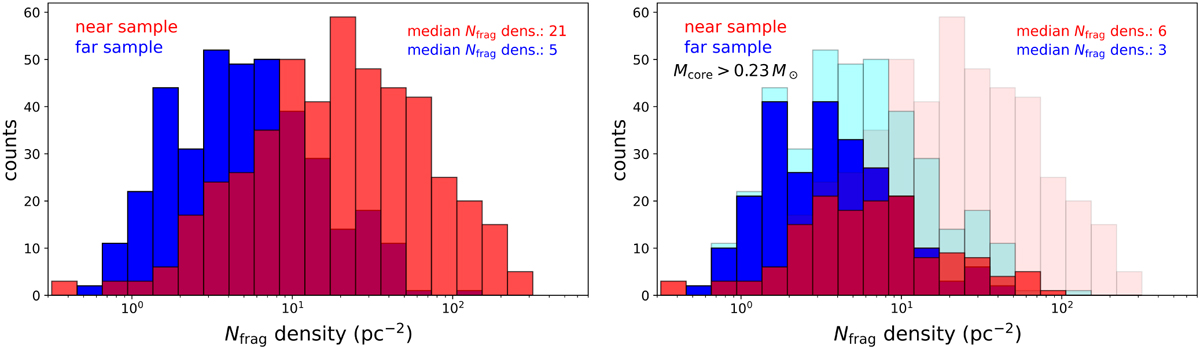
Analysis of the derived spatial density of the cores. Left panel: distribution of the spatial density of the cores within each clump for near sample (red bars) and far sample (blue bars) sources, respectively. Right panel: same as left panel, but only including clumps containing core masses above 0.23 M⊙. For comparison, the overall distributions of the left panel appear here in transparency in the background as pink (near sample) and cyan (far sample) bars, respectively. In both panels, overlapping areas between the two distributions are marked by the magenta bars. The median values of the near and far sample distributions are also reported in each panel.
Current usage metrics show cumulative count of Article Views (full-text article views including HTML views, PDF and ePub downloads, according to the available data) and Abstracts Views on Vision4Press platform.
Data correspond to usage on the plateform after 2015. The current usage metrics is available 48-96 hours after online publication and is updated daily on week days.
Initial download of the metrics may take a while.