Fig. 1
Download original image
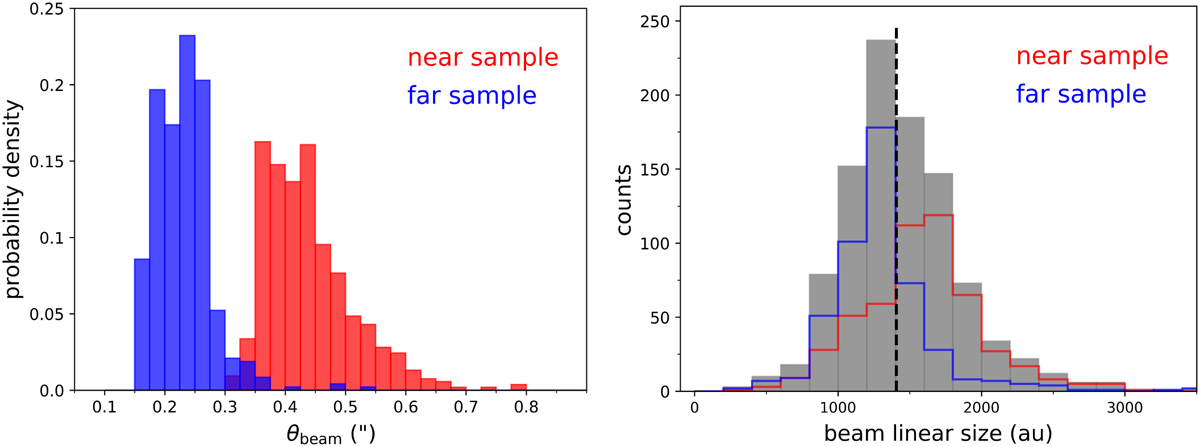
Beam properties of the ALMAGAL continuum maps. Left panel: probability density distribution of the circularized angular sizes of the map beam, separately for near (red) and far (blue) observational samples, respectively (see Sánchez-Monge et al. 2025 for more details). Right panel: distribution of the corresponding linear sizes (i.e., achieved spatial resolution). The grey histogram represents the overall distribution, with the vertical dashed black line marking its median value (1400 au). Near and far subsamples are overplotted with the same color coding of the left panel. It can be noted that, due to the distance variation across our sample, the bimodal distribution in the left panel converts into a fairly uniform beam linear size overall distribution (see text for details).
Current usage metrics show cumulative count of Article Views (full-text article views including HTML views, PDF and ePub downloads, according to the available data) and Abstracts Views on Vision4Press platform.
Data correspond to usage on the plateform after 2015. The current usage metrics is available 48-96 hours after online publication and is updated daily on week days.
Initial download of the metrics may take a while.