Fig. 4
Download original image
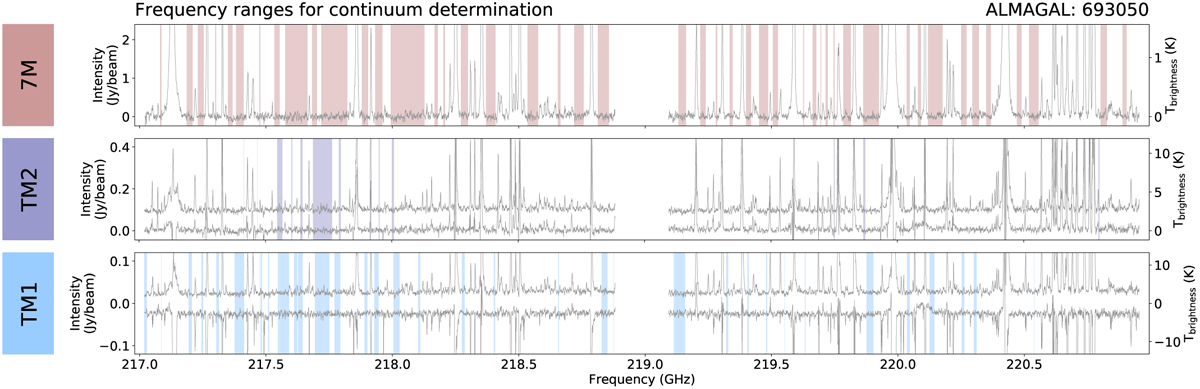
Frequency ranges used for continuum determination for the ALMAGAL target 693050 (also labelled AG301.1365–0.2259 in Molinari et al. 2025). The continuum ranges identified by findcont are depicted as shaded color areas across the spectra. From top to bottom, the different rows show the spectra extracted in the different array configurations: 7M (top), TM2 (center), and TM1 (bottom). For TM1 and TM2, the spectra were extracted towards two different positions (not resolved in the 7M image) corresponding to the bright compact sources also seen in the TM2 panels of Fig. 7. These positions have been chosen as examples of complex line-rich cases with both emission and absorption features (as seen in the spectra of the TM1 panel). The frequency range correspond to spw0 and spw1 spectral windows (cf. Fig. 2).
Current usage metrics show cumulative count of Article Views (full-text article views including HTML views, PDF and ePub downloads, according to the available data) and Abstracts Views on Vision4Press platform.
Data correspond to usage on the plateform after 2015. The current usage metrics is available 48-96 hours after online publication and is updated daily on week days.
Initial download of the metrics may take a while.