Fig. 14
Download original image
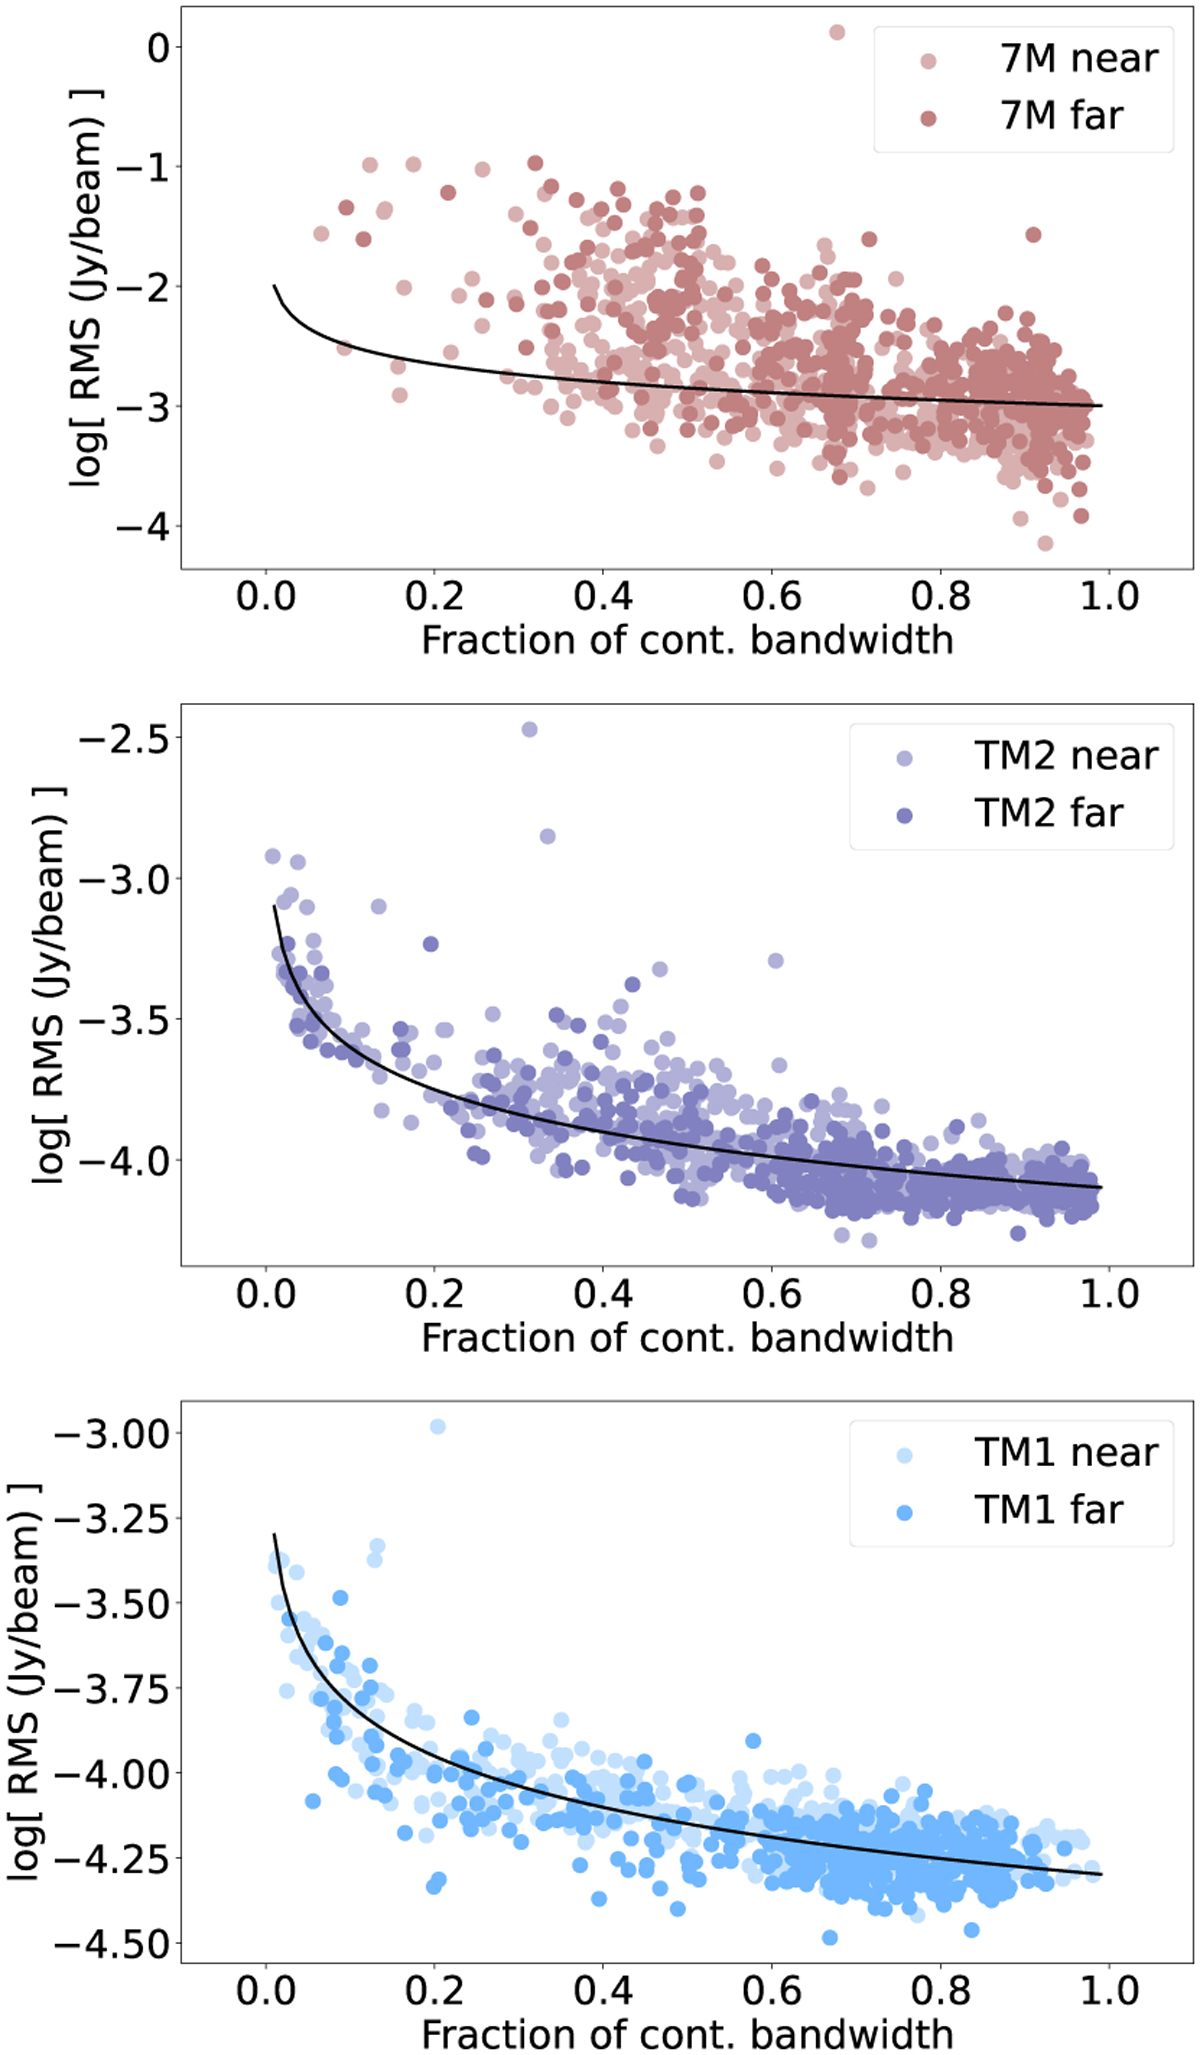
Relation between rms noise level and available fraction of frequency bandwidth used to derive the continuum emission. From top to bottom, the panels show the results for the images of the 7M, TM2, and TM1 individual arrays. The rms noise level increases by a factor of three for narrow continuum bandwidths. The black solid lines depict the theoretical relation of the rms noise level as function of the available bandwidth (i.e., rms ![]() ). Note that the continuum bandwidth is normalized to the total available bandwidth, corresponding to 3.75 GHz (i.e., spw0 and spw1 combined).
). Note that the continuum bandwidth is normalized to the total available bandwidth, corresponding to 3.75 GHz (i.e., spw0 and spw1 combined).
Current usage metrics show cumulative count of Article Views (full-text article views including HTML views, PDF and ePub downloads, according to the available data) and Abstracts Views on Vision4Press platform.
Data correspond to usage on the plateform after 2015. The current usage metrics is available 48-96 hours after online publication and is updated daily on week days.
Initial download of the metrics may take a while.