Fig. 12
Download original image
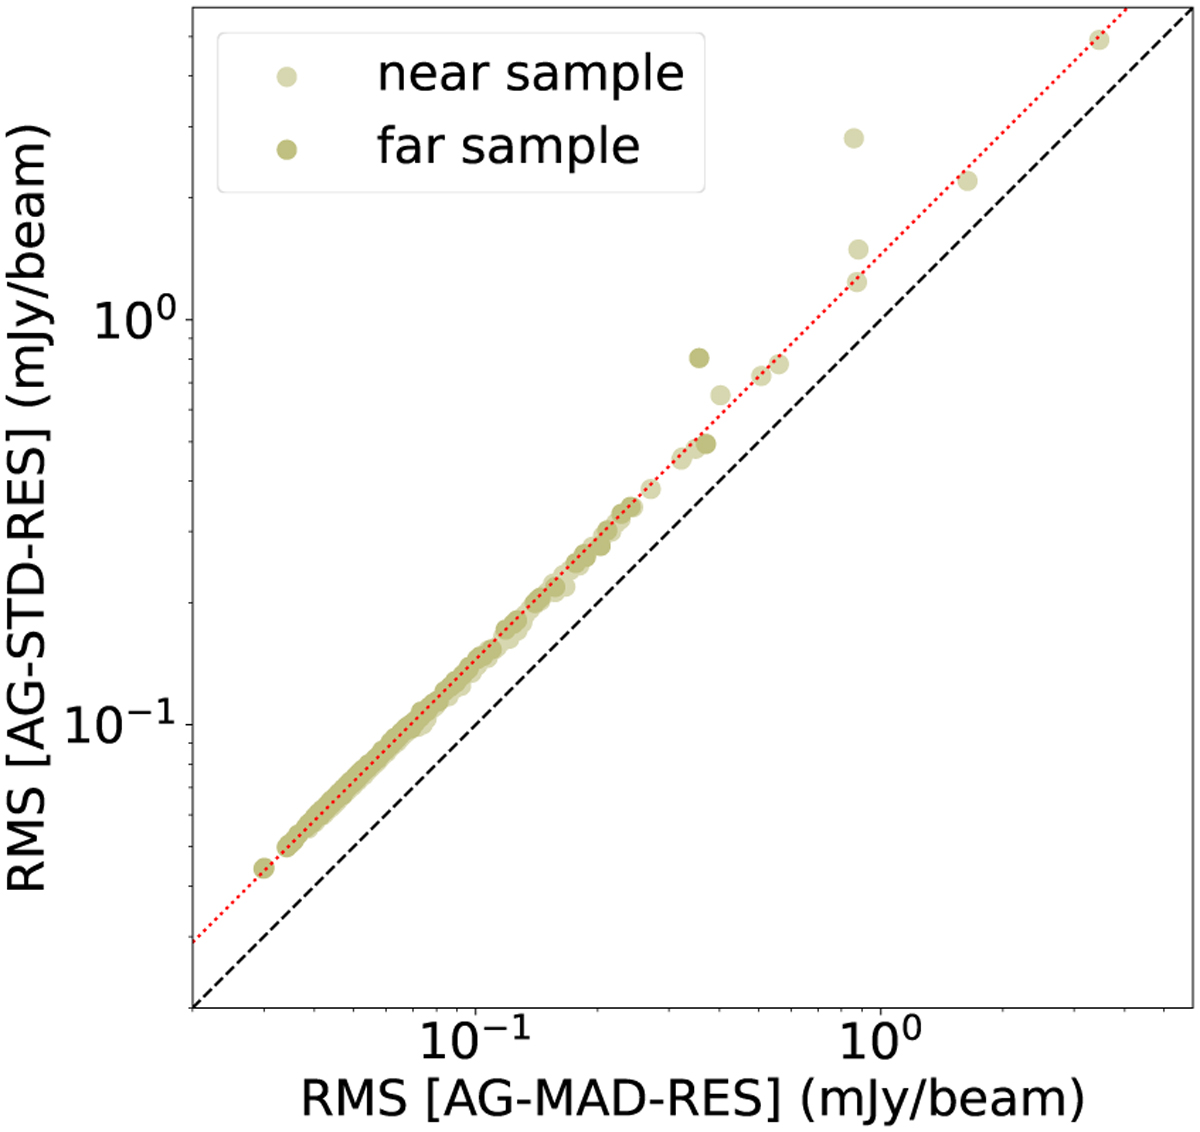
Comparison of different rms noise level estimates for the final ALMAGAL 7M+TM2+TM1 continuum images. The noise is calculated as the standard deviation of the residual image (AG-STD-RES) as a function of the noise calculated as the median absolute deviation of the residual image (AG-MAD-RES). The black dashed lines corresponds to y = x, while the red dotted line corresponds to y = 1.45 x (i.e., the rms noise level estimated with the standard deviation is about 45% larger compared to the median absolute deviation estimate).
Current usage metrics show cumulative count of Article Views (full-text article views including HTML views, PDF and ePub downloads, according to the available data) and Abstracts Views on Vision4Press platform.
Data correspond to usage on the plateform after 2015. The current usage metrics is available 48-96 hours after online publication and is updated daily on week days.
Initial download of the metrics may take a while.