Fig. 8
Download original image
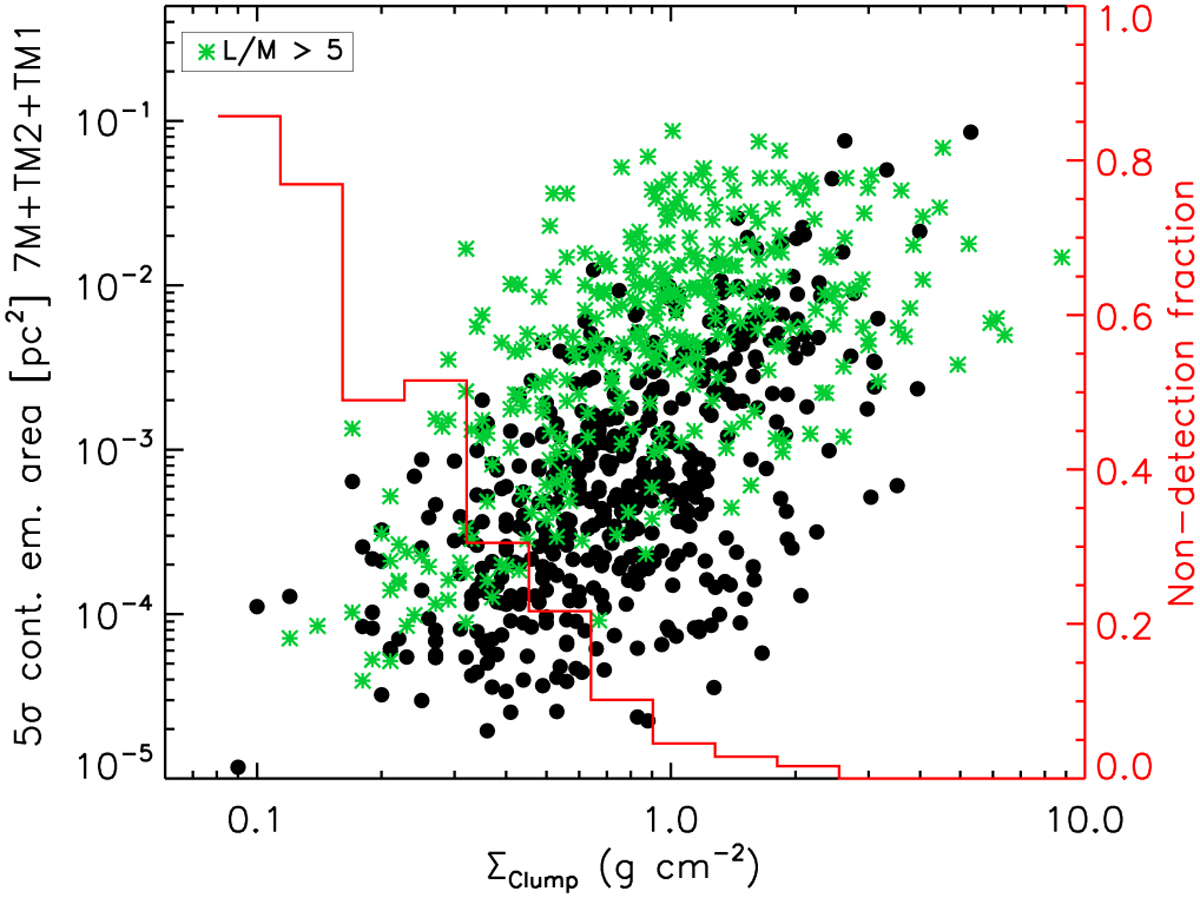
ALMA 1.38 mm total emission area above 5σ in 7M+TM2+TM1 images as a function of the clump surface density from Table 1. The green symbols are for target clumps with L/M ≥ 5. The red histogram reports the fractional distribution of the surface density for ALMAGAL sources with no 5σ detection (to be read on the red right y-axis).
Current usage metrics show cumulative count of Article Views (full-text article views including HTML views, PDF and ePub downloads, according to the available data) and Abstracts Views on Vision4Press platform.
Data correspond to usage on the plateform after 2015. The current usage metrics is available 48-96 hours after online publication and is updated daily on week days.
Initial download of the metrics may take a while.