Open Access
Fig. 11
Download original image
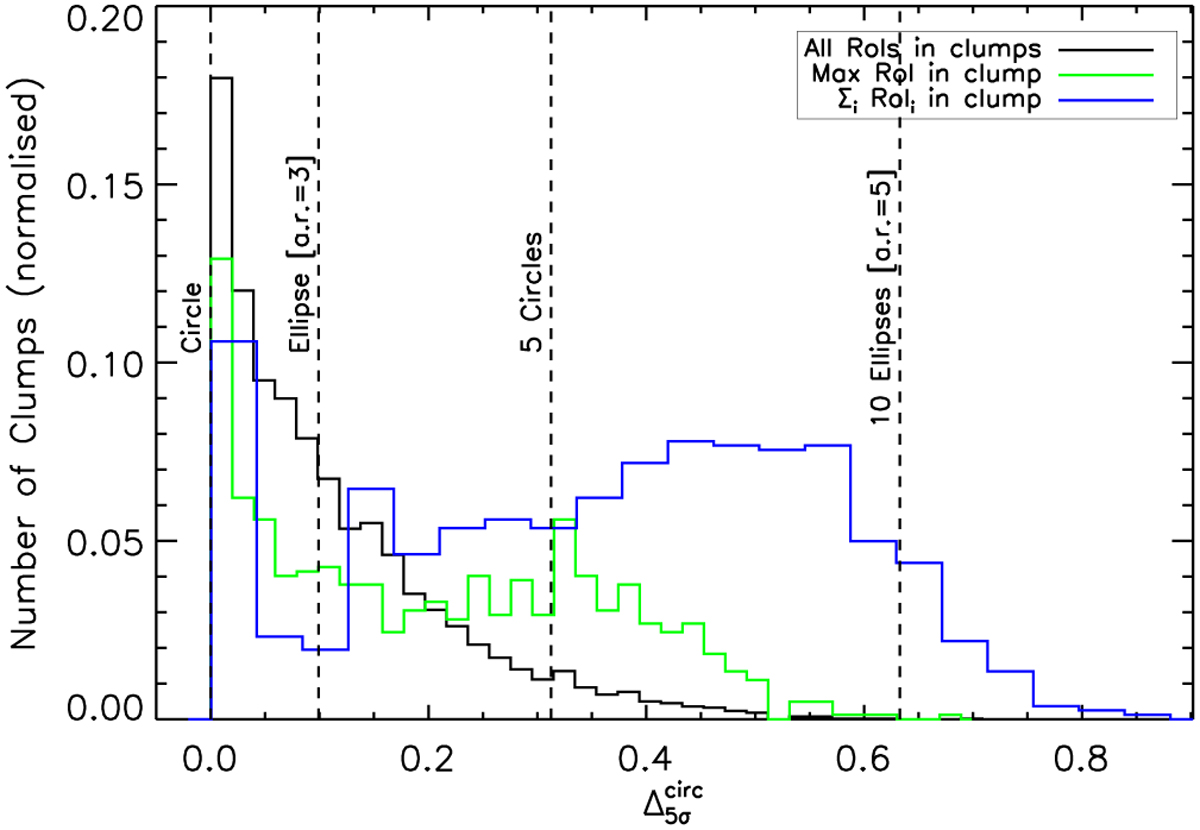
Normalized histograms of the ![]() parameter for the largest RoI in each field (black line) and for all 5σ RoIs in the fields. The
parameter for the largest RoI in each field (black line) and for all 5σ RoIs in the fields. The ![]() values corresponding to the loci indicated by the colored lines in Fig. 10 are also reported here for reference.
values corresponding to the loci indicated by the colored lines in Fig. 10 are also reported here for reference.
Current usage metrics show cumulative count of Article Views (full-text article views including HTML views, PDF and ePub downloads, according to the available data) and Abstracts Views on Vision4Press platform.
Data correspond to usage on the plateform after 2015. The current usage metrics is available 48-96 hours after online publication and is updated daily on week days.
Initial download of the metrics may take a while.