Fig. 9.
Download original image
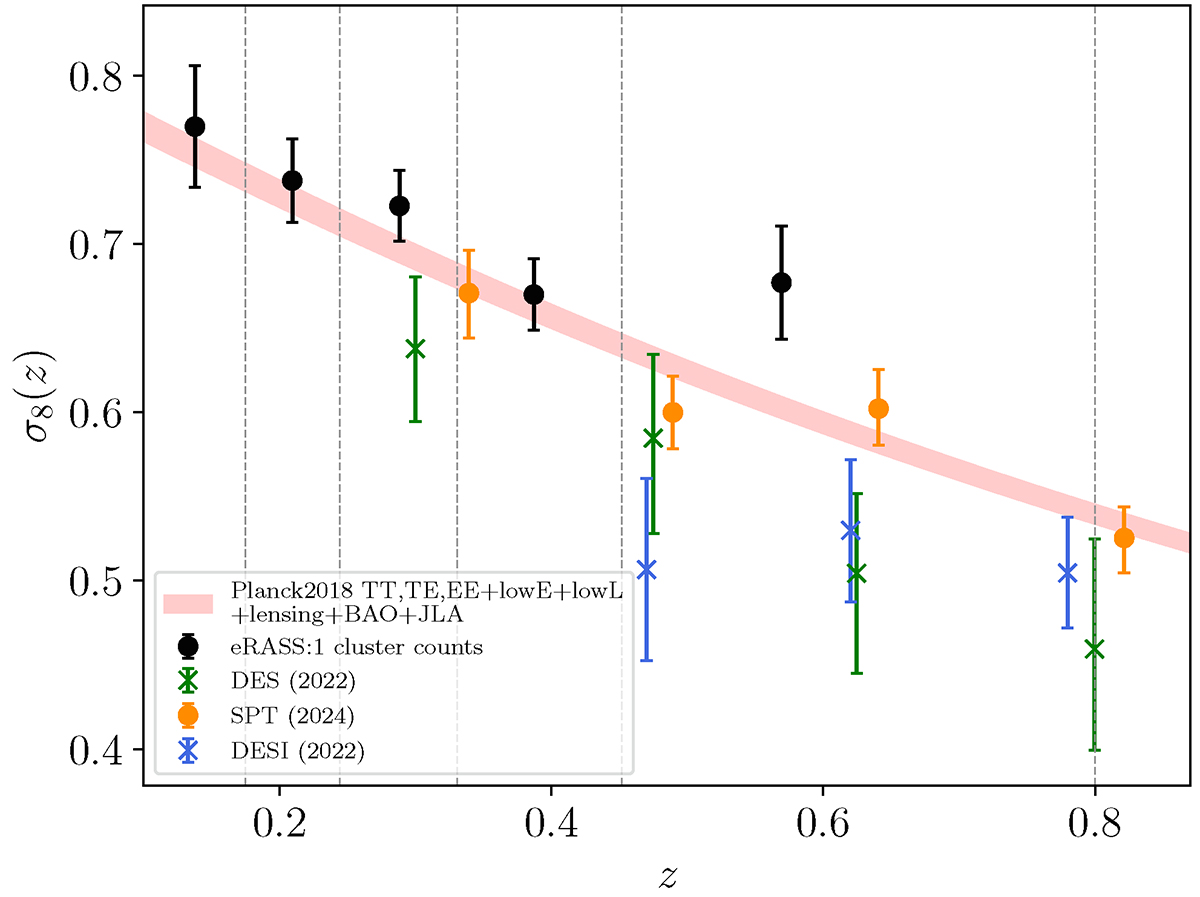
Redshift evolution of the rms density fluctuation in 8 h−1 Mpc, σ8(z). The red curve is the 1σ model obtained from Planck, galaxy clustering, and supernovae data, assuming linear perturbation theory. The black dots are obtained with CMB sound horizon priors from the Planck satellite. The orange points are the results of SPT cluster abundance from Bocquet et al. (2024) when the cluster data are combined with the horizon scale of the cosmic microwave background. We also provide the latest DES cosmic shear results presented in Abbott et al. (2023) in green. Finally, the results of the DESI legacy imaging survey combined with CMB lensing are shown in blue (White et al. 2022). Overall, probes that include strong nonlinear effects find a lower normalization of the growth of structure. We note that the highest redshift bin probed by eRASS1 cluster count is significantly higher than the prediction of the CMB. We investigate this result by removing the highest bin and reprocessing all the models presented in this work, as well as the ΛCDM standard model. We find that our conclusions are robust against removing this bin (see Figure 10 and Appendix E).
Current usage metrics show cumulative count of Article Views (full-text article views including HTML views, PDF and ePub downloads, according to the available data) and Abstracts Views on Vision4Press platform.
Data correspond to usage on the plateform after 2015. The current usage metrics is available 48-96 hours after online publication and is updated daily on week days.
Initial download of the metrics may take a while.