Fig. 7.
Download original image
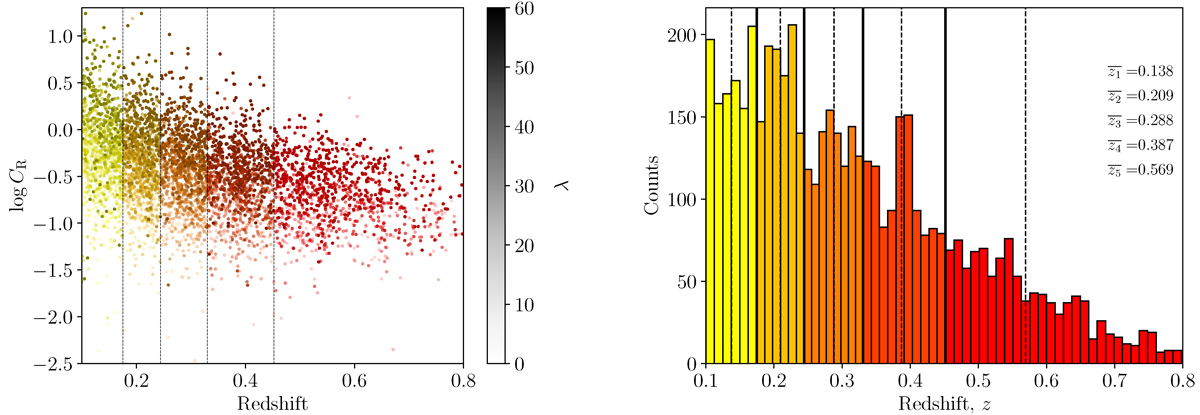
Left: X-ray count rate distribution as a function of redshift shown for the redshift bins used to constrain structure growth. We use the same ΛCDM parametrization in each bin. The different colors represent the separation. The intensity of the colors represents the richness. The observable distribution in the five subsamples differs as expected; in particular, count rates are higher at low redshift for fixed richness. Right: Redshift distribution of the clusters in each bin. The mean redshift of each subsample is represented with an overline. Although the volume probed increases with the redshift, the number of objects decreases due to the eRASS1 selection function.
Current usage metrics show cumulative count of Article Views (full-text article views including HTML views, PDF and ePub downloads, according to the available data) and Abstracts Views on Vision4Press platform.
Data correspond to usage on the plateform after 2015. The current usage metrics is available 48-96 hours after online publication and is updated daily on week days.
Initial download of the metrics may take a while.