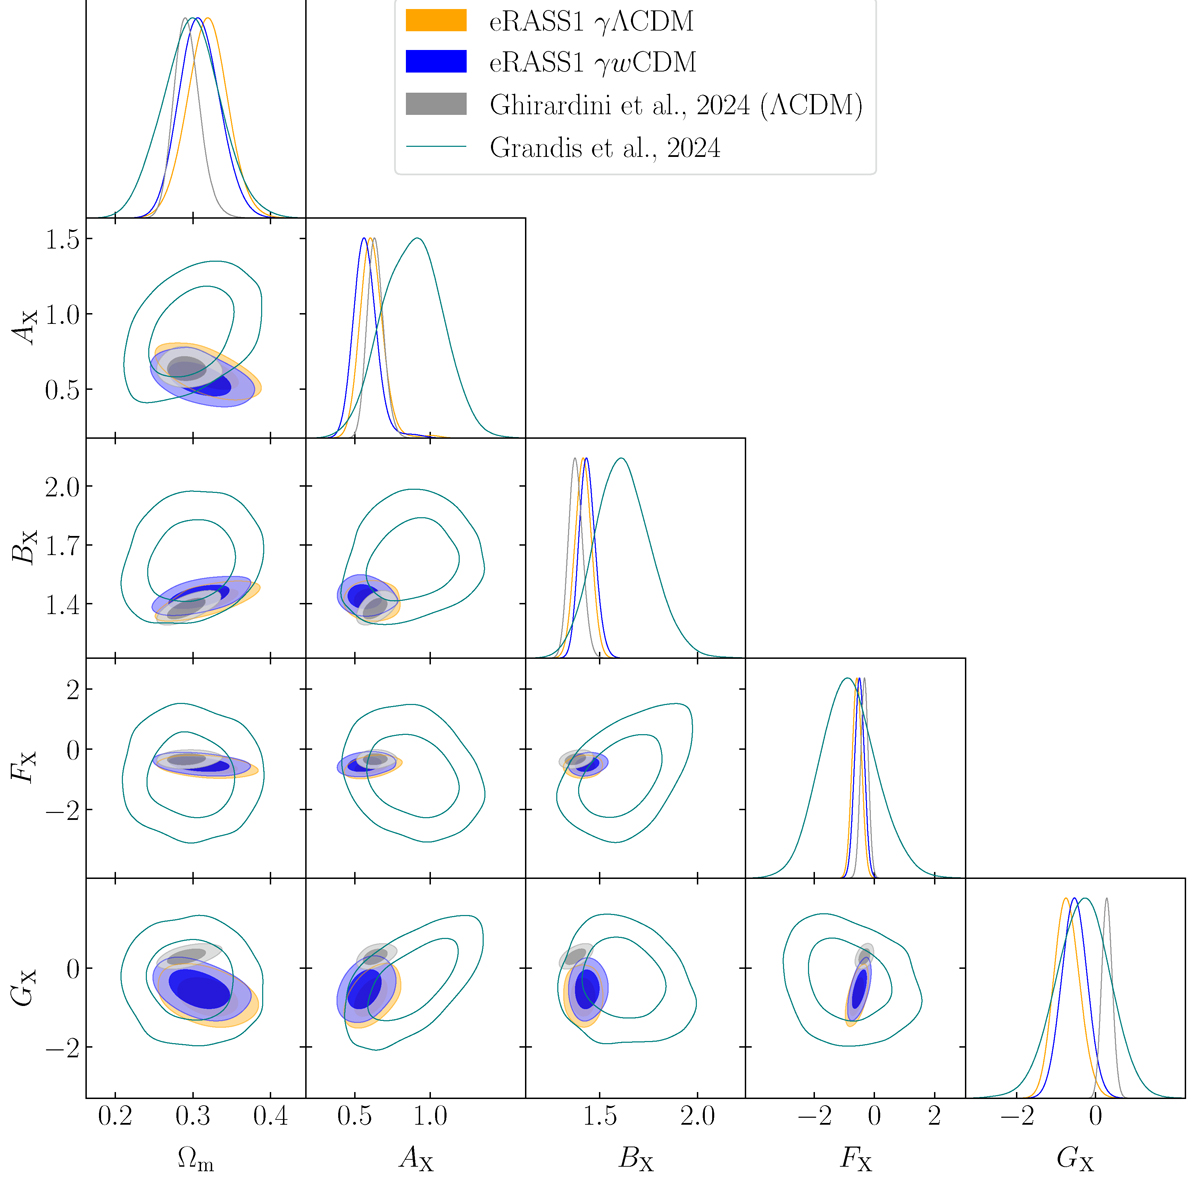
Fig. D.1.
Download original image
Posterior distribution of parameters of the X-ray scaling relation presented in Section 7.2. The ΛCDM contours are shown in gray, the γ − ΛCDM ones in orange, and the γ − wCDM in blue. The weak lensing information likelihood posteriors are represented with the emerald line. The parameters of the scaling relation are mostly consistent against the changes in the modeling, except for the GX, quantifying the redshift dependence of the count rate to mass (CR − M) and redshift relation.
Current usage metrics show cumulative count of Article Views (full-text article views including HTML views, PDF and ePub downloads, according to the available data) and Abstracts Views on Vision4Press platform.
Data correspond to usage on the plateform after 2015. The current usage metrics is available 48-96 hours after online publication and is updated daily on week days.
Initial download of the metrics may take a while.