Fig. 13.
Download original image
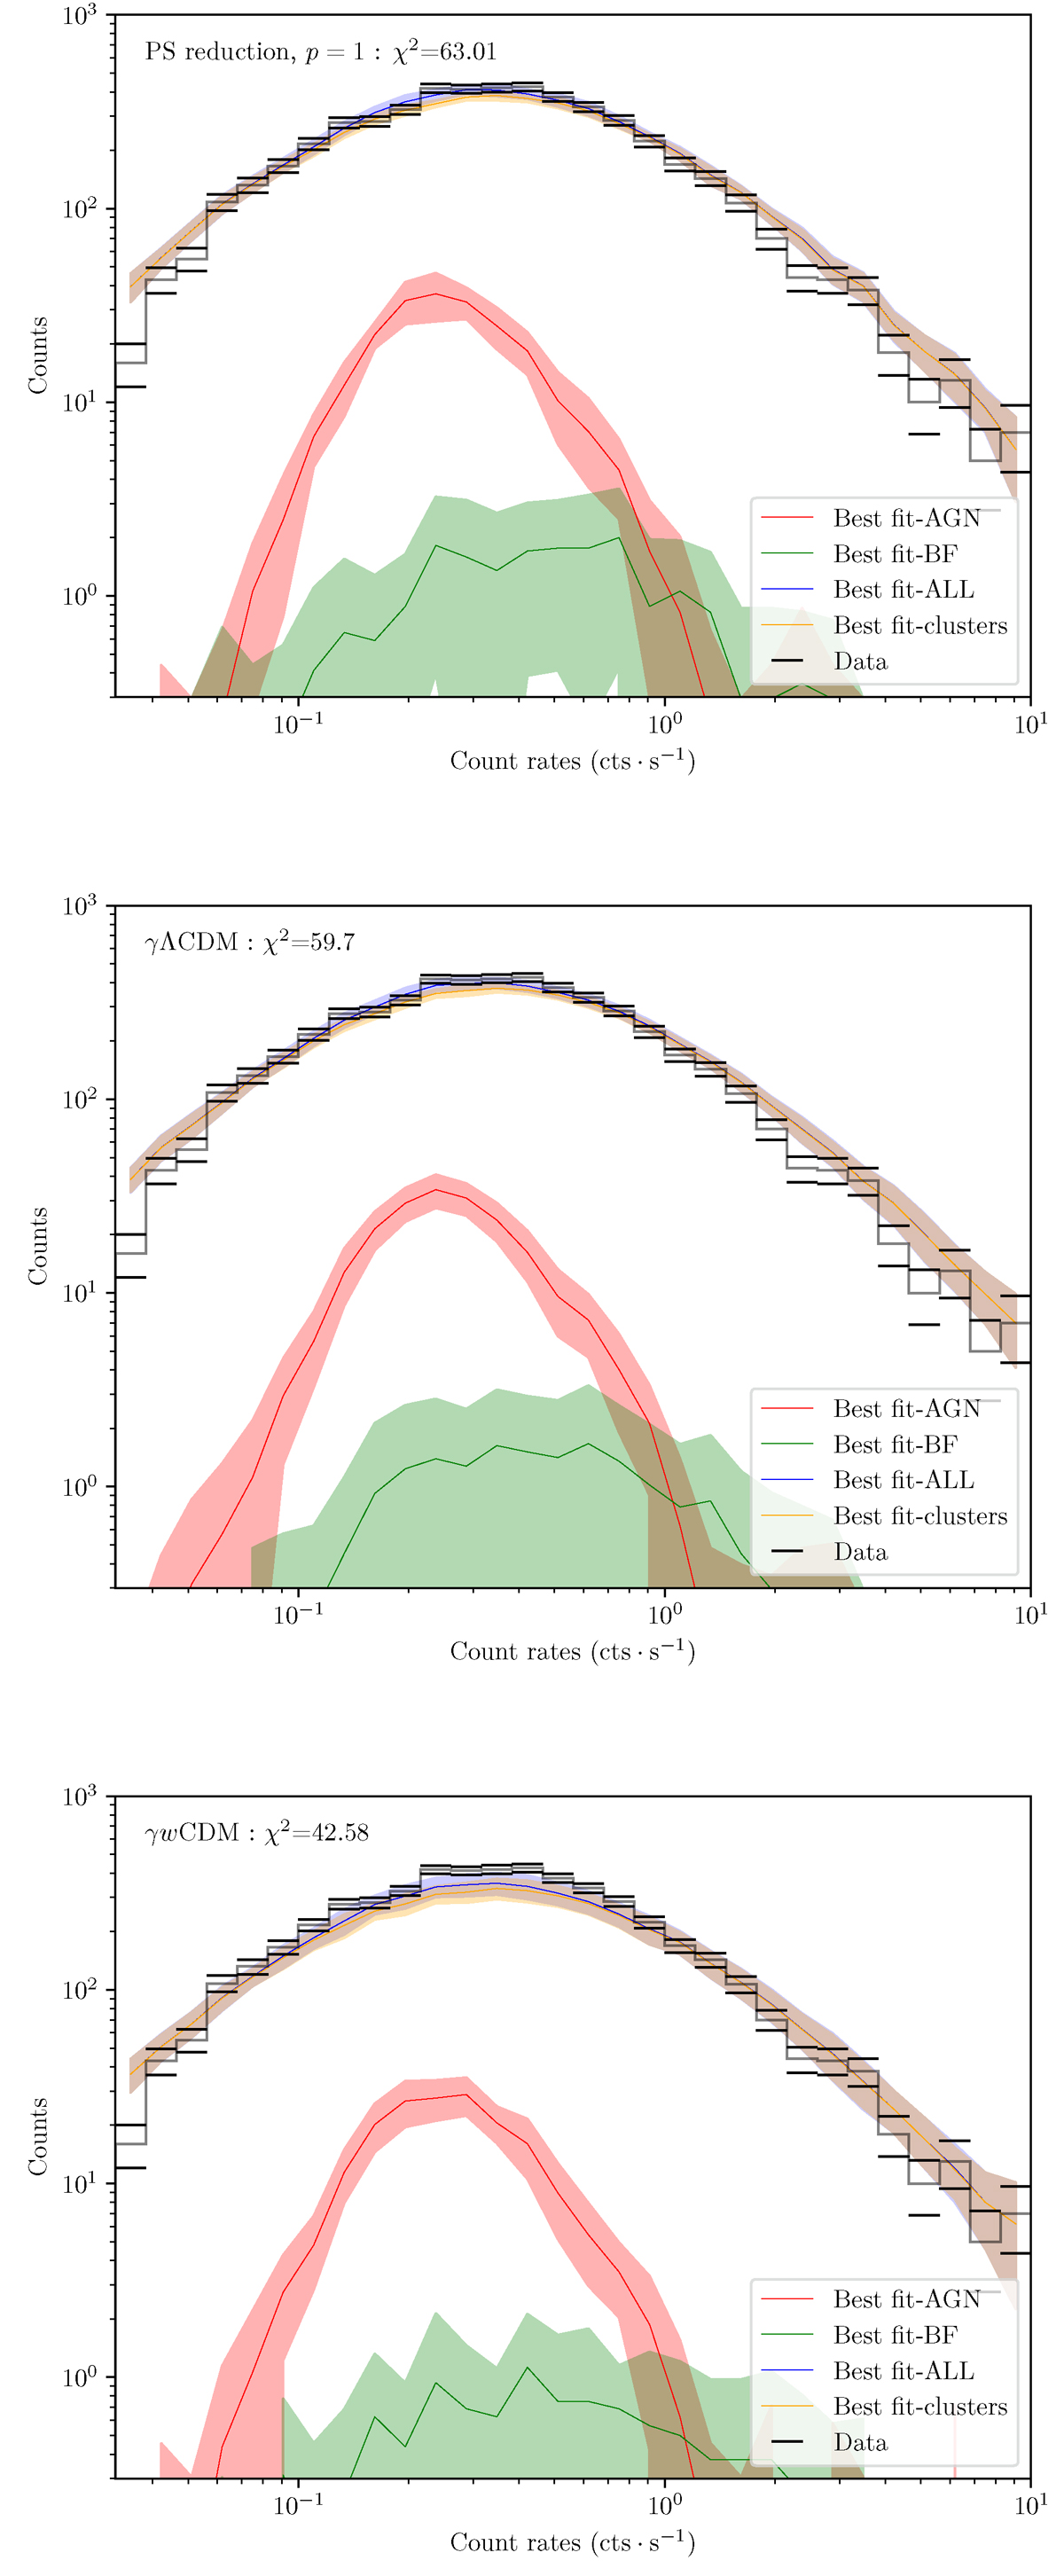
Goodness of fit for the three models fitted in this analysis: the power spectrum reduction model Lin et al. (2024) with p = 1 fixed, γΛCDM, and γwCDM. The combination of all the model components is shown in blue, while the cluster is in orange. We also show the contaminants with the active galactic nuclei (AGN, in red) and false detections due to background fluctuations (BF, in green). The filled areas represent the 68% errors on each component. The gray solid line represents the data distribution, and the black line represents the Poisson uncertainties in each bin.
Current usage metrics show cumulative count of Article Views (full-text article views including HTML views, PDF and ePub downloads, according to the available data) and Abstracts Views on Vision4Press platform.
Data correspond to usage on the plateform after 2015. The current usage metrics is available 48-96 hours after online publication and is updated daily on week days.
Initial download of the metrics may take a while.