Fig. 2.
Download original image
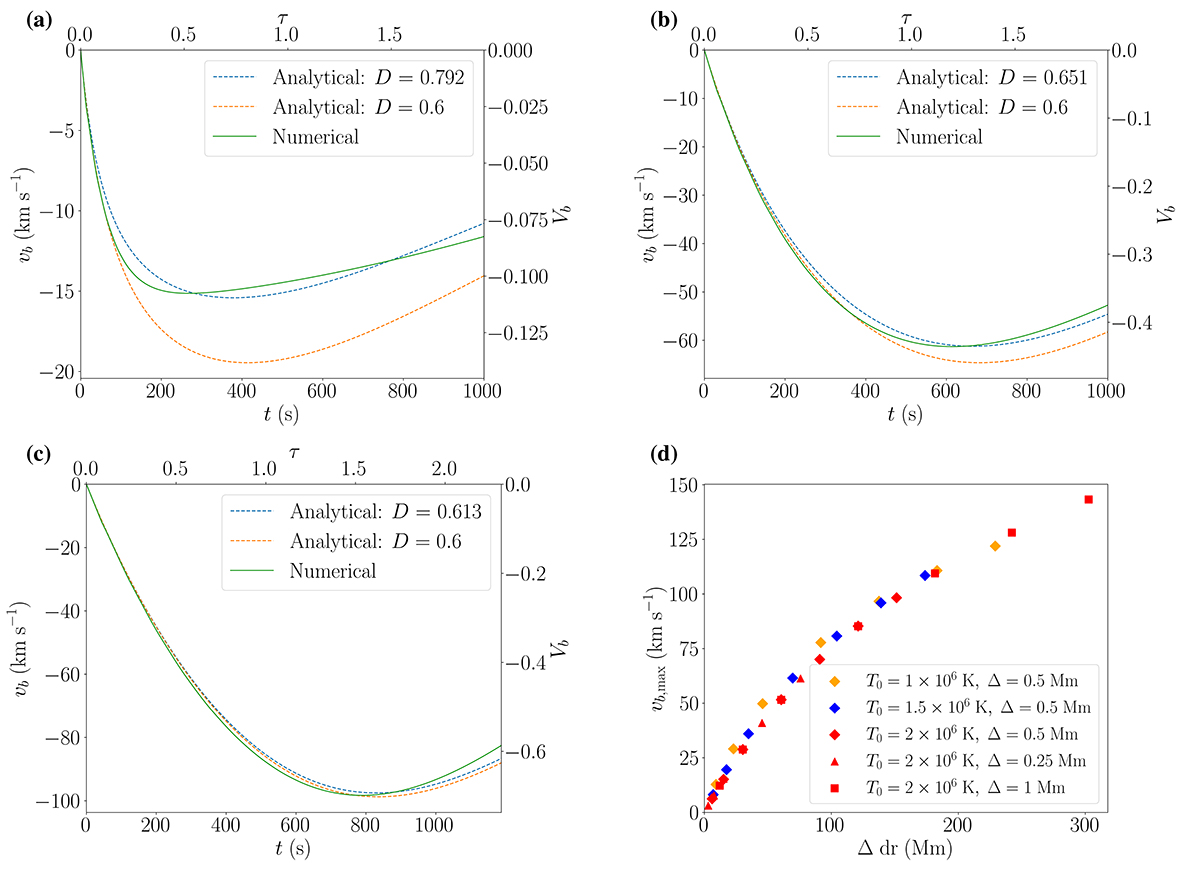
Blob velocity as a function of time for three setups with T0 = 2 × 10⁶ K, Δ = 0.5 Mm, and (a) ρb0 = 10−10 kg m−3, (b) ρb0 = 5 × 10⁻¹⁰ kg m−3, and (c) ρb0 = 10 × 10−10 kg m−3. The green curve comes from the numerical solution of Equations (1)–(3), whereas the analytical approximation of Equation (18) is given by the blue and orange curves for the best fit of D and for D = 0.6, respectively. The variables τ and Vb are the dimensionless time and blob speed (see Section 3.2). (d) (Unsigned) maximum blob velocity, vb, max, vs. Δ dr (the meaning of the different symbols is given in the figure legend).
Current usage metrics show cumulative count of Article Views (full-text article views including HTML views, PDF and ePub downloads, according to the available data) and Abstracts Views on Vision4Press platform.
Data correspond to usage on the plateform after 2015. The current usage metrics is available 48-96 hours after online publication and is updated daily on week days.
Initial download of the metrics may take a while.