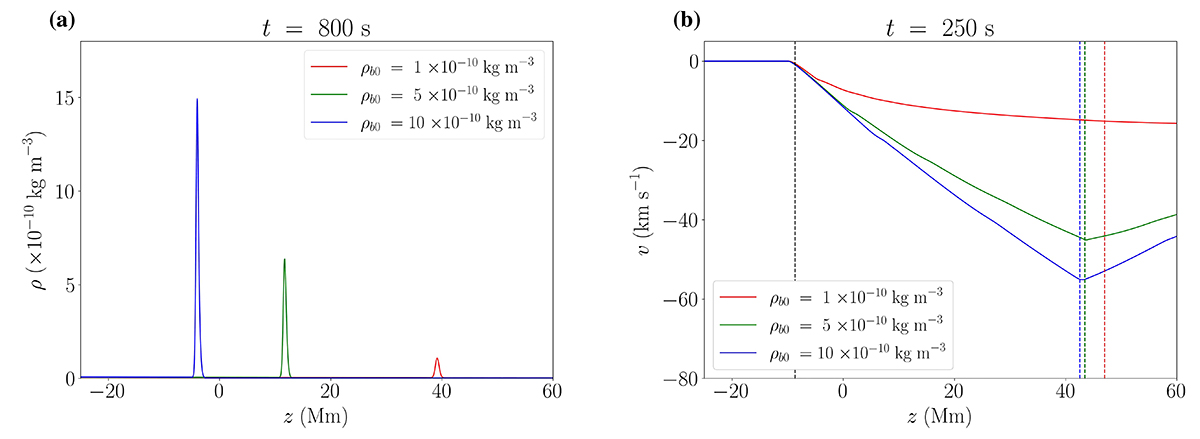
Fig. 1.
Download original image
Results of three numerical simulations with with T0 = 2 × 10⁶ K, Δ = 0.5 Mm, and ρb0 = 10−10 kg m−3 (red), ρb0 = 5 × 10⁻¹⁰ kg m−3 (green), and ρb0 = 10 × 10−10 kg m−3 (blue). (a) Density as a function of height at a given time. (b) Velocity as a function of height at a given time. A dashed vertical black line is plotted at z = z0 − Cst giving the position of the front of the compression wave. The dashed vertical red, green, and blue lines give the position of the maximum density. Animations of these figures can be found online.
Current usage metrics show cumulative count of Article Views (full-text article views including HTML views, PDF and ePub downloads, according to the available data) and Abstracts Views on Vision4Press platform.
Data correspond to usage on the plateform after 2015. The current usage metrics is available 48-96 hours after online publication and is updated daily on week days.
Initial download of the metrics may take a while.