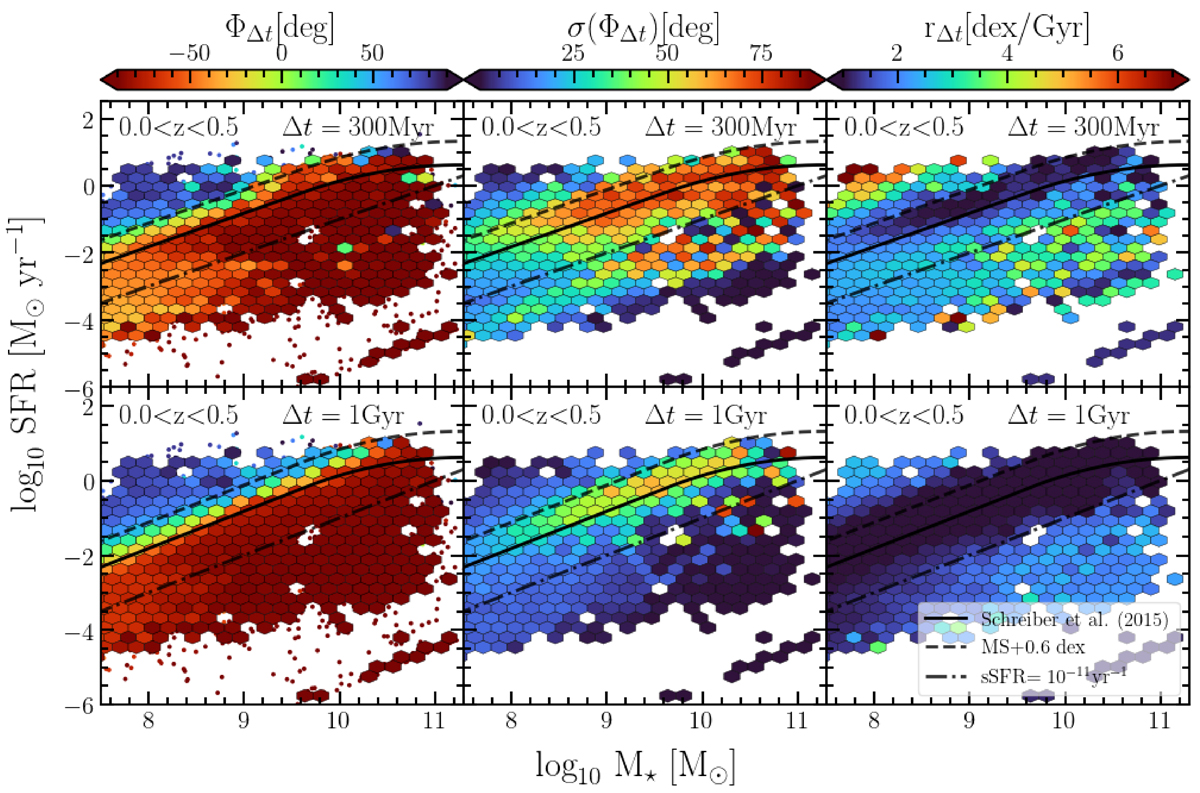
Fig. 7.
Download original image
Three-panel visualization of the M⋆ − SFR plane at 0 < z < 0.5 binned in hexagonal 2D cells and color coded according to different parameters. In the left panels, the cells are color coded according to the median angle of migration (ΦΔt) providing insights into the trajectory directions within the plane. In the middle panels, the color scheme represents the dispersion on ΦΔt indicating the variety of directions. The right panel, the color coding depicts the amplitude of displacement (rΔt) observed over the recent history of the galaxy sample. The upper and lower panels correspond to a chosen timescale Δt of 300 Myr and 1000 Myr, respectively.
Current usage metrics show cumulative count of Article Views (full-text article views including HTML views, PDF and ePub downloads, according to the available data) and Abstracts Views on Vision4Press platform.
Data correspond to usage on the plateform after 2015. The current usage metrics is available 48-96 hours after online publication and is updated daily on week days.
Initial download of the metrics may take a while.