Fig. 5.
Download original image
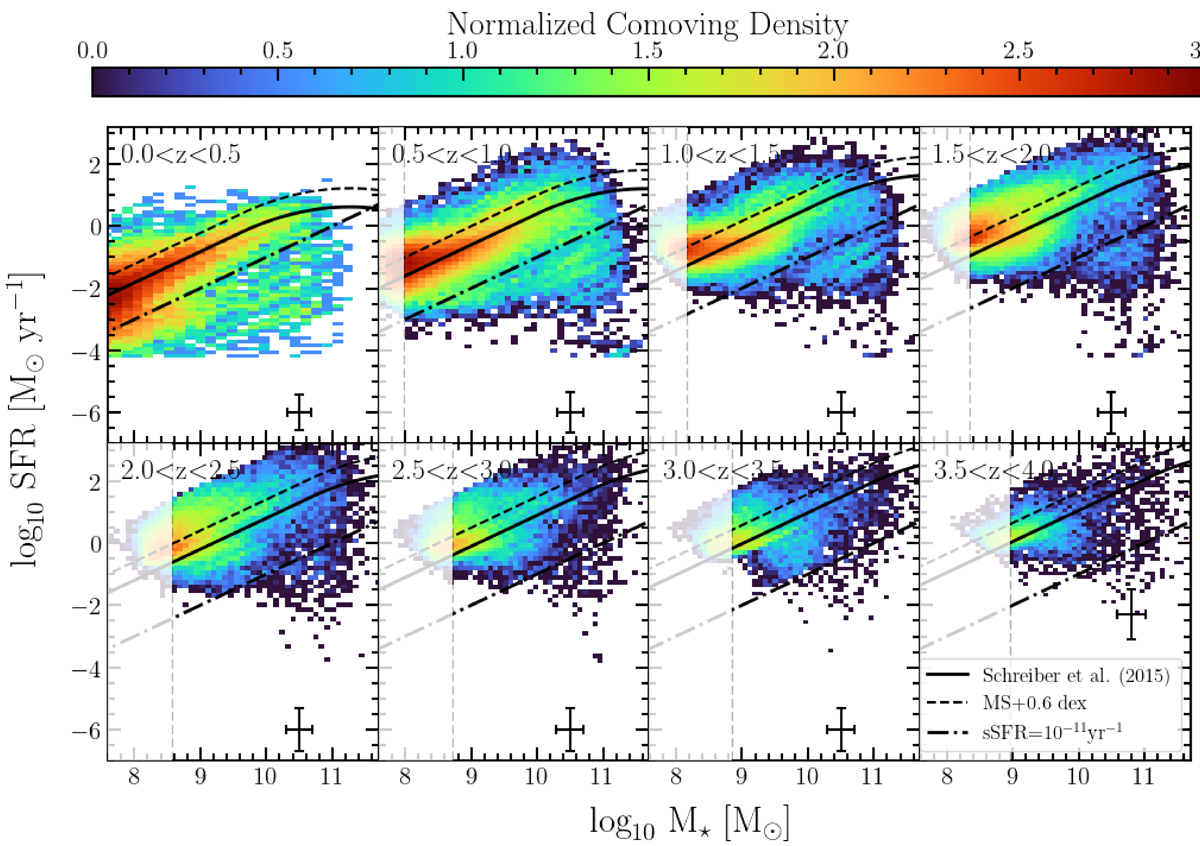
Two-dimensional histogram illustrating the M⋆ − SFR plane across redshifts z = 0 to 4 color coded by the density of sources over the plane. Each cell in the histogram represents the mean normalized comoving density within a particular region of the M⋆ − SFR plane. Cells are displayed only when they contain at least ten galaxies, ensuring statistical robustness. Among these parametrizations, the model proposed by Schreiber et al. (2015) (black solid line) presents the closest agreement with the observed dense regions within the histogram. The black dashed line presents the limit on which the SB region is considered (ΔMS > 0.6 dex, Rodighiero et al. 2011), while the dashed-doted black line shows the limit for the passive region (sSFR < 10−11 yr−1). The white-shaded regions indicate the mass completeness limits obtained following the method outlined by Pozzetti et al. (2010).
Current usage metrics show cumulative count of Article Views (full-text article views including HTML views, PDF and ePub downloads, according to the available data) and Abstracts Views on Vision4Press platform.
Data correspond to usage on the plateform after 2015. The current usage metrics is available 48-96 hours after online publication and is updated daily on week days.
Initial download of the metrics may take a while.