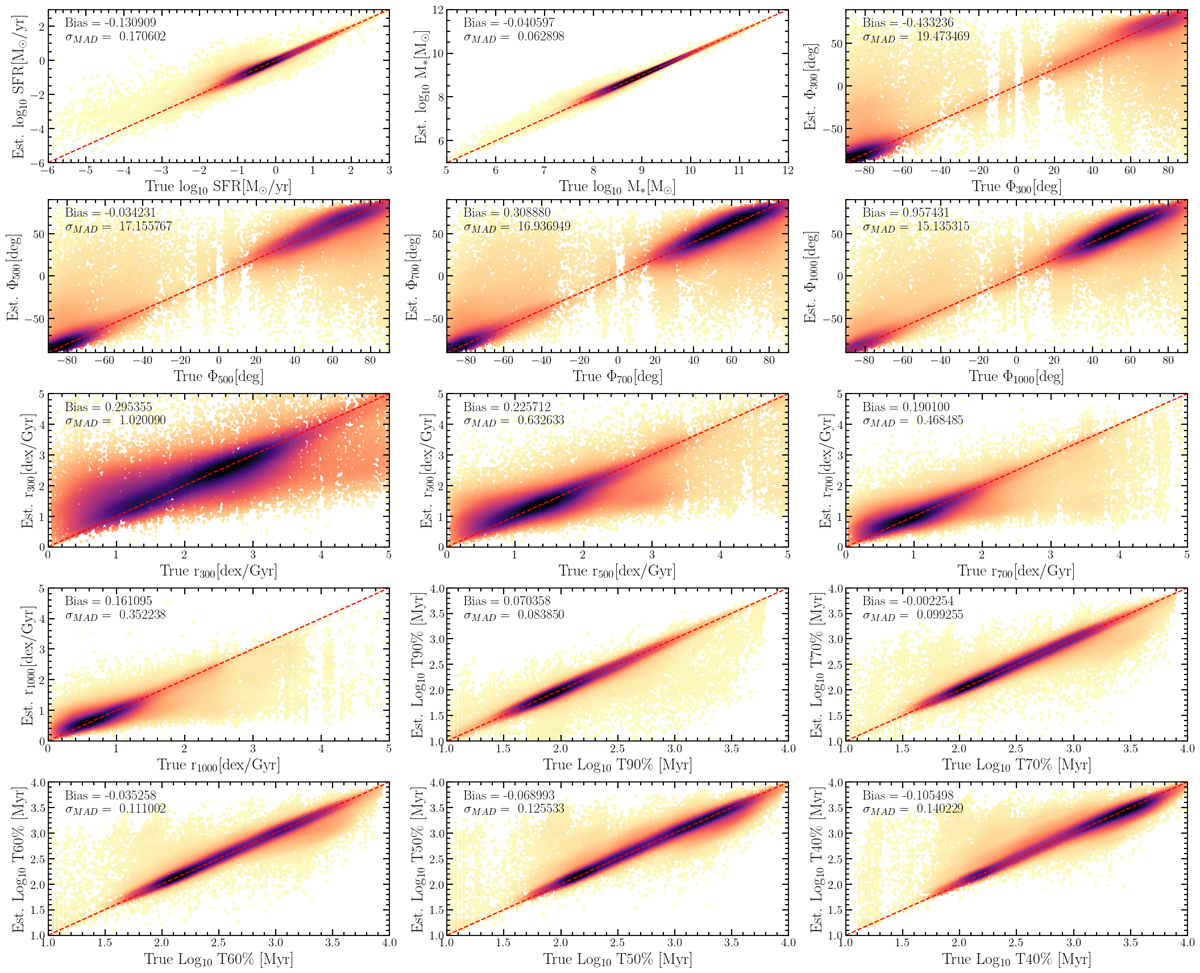
Fig. 3.
Download original image
Results of the mock analysis on the SED modeling using the non-parametric SFH model. The input parameters used to build the mock catalog are shown on the x-axis, and the results from fitting the mock catalogs are shown on the y-axis. From left to right, the upper panels present the instantaneous SFR (here defined as the SFH in the first bin of 10 Myr), and the stellar mass M⋆. The ΦΔt values are presented as defined on Eq. (1) and computed over the last 300 to 1000 Myr, on the uppermost right panel and over the second-row panels. The third row and the left panel of the fourth row count for rΔt (i.e., the norm of the migration vector) computed over the same timescales as ΦΔt. The two rightmost panels on the fourth row and bottom panels present the mass formation times (noted Ti%[Myr] and defined as the time taken to form the {i} percentage of a galaxy’s total stellar mass) for the 90 to the 40%. The solid black lines indicate the one-to-one relation. The bias and precision estimated for the parameters are indicated in each panel.
Current usage metrics show cumulative count of Article Views (full-text article views including HTML views, PDF and ePub downloads, according to the available data) and Abstracts Views on Vision4Press platform.
Data correspond to usage on the plateform after 2015. The current usage metrics is available 48-96 hours after online publication and is updated daily on week days.
Initial download of the metrics may take a while.