Fig. 19.
Download original image
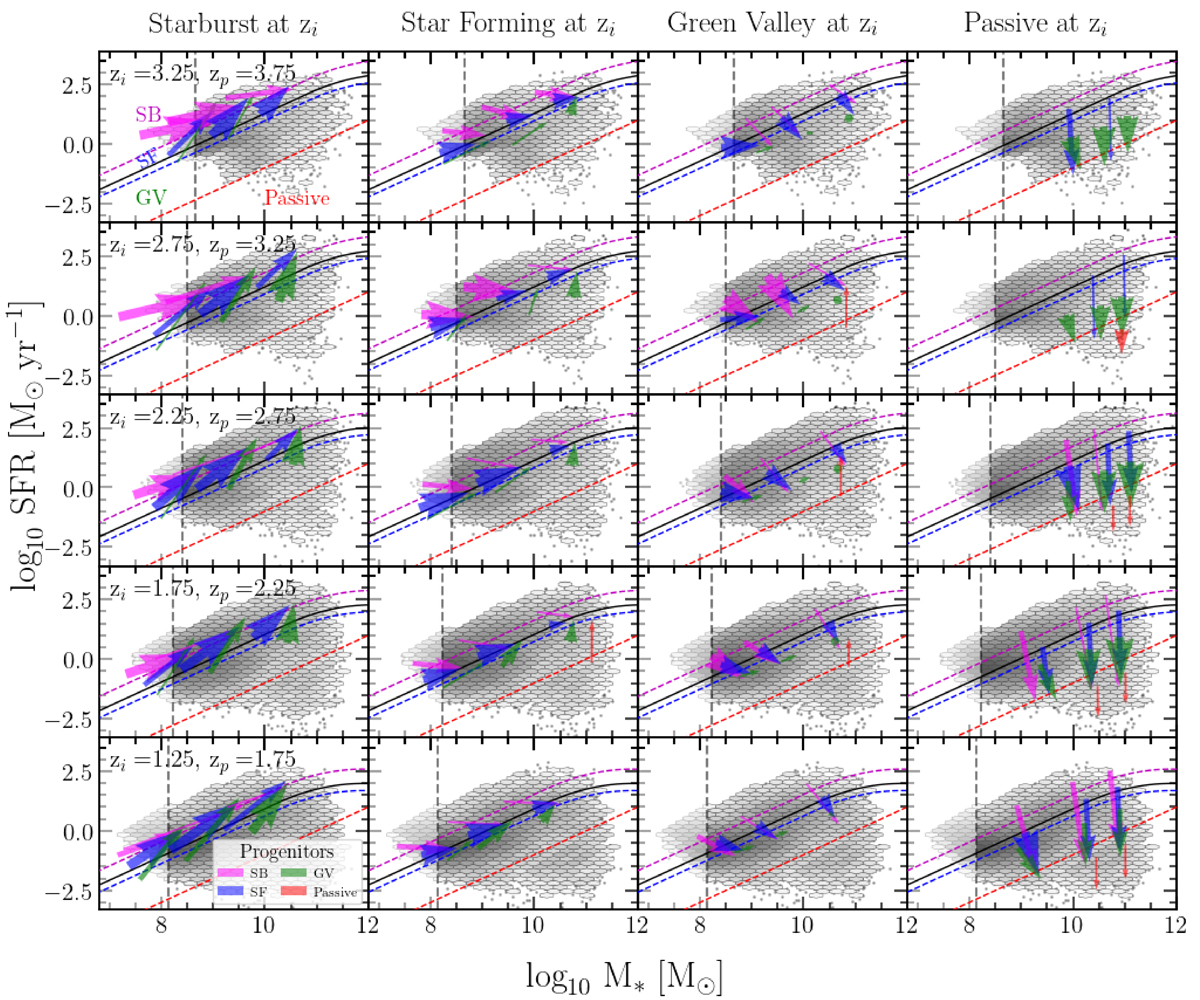
Schematic view of galaxy migrations across different redshift bins in the M⋆ − SFR plane. The hexagonal bins represent the galaxy number density at redshift zi. The arrows represent how galaxies move from a redshift zp to a redshift zi. For each redshift zi, we trace back the progenitors of galaxies to their positions at earlier redshifts zp, using migration vector (![]() ) that indicates the direction and velocity of galaxy evolution over the time interval elapsed between zp and zi. The arrows are color coded by the progenitor population: SB, star forming, GV, and passive. The width of the arrows is modulated by the relative fraction of sources originating from the respective regions. The head of each arrow corresponds to the galaxy positions at zi, while the tail represents their positions in different regions at zp. The head’s arrow position in each panel is calculated for stellar mass bins equally spaced over the mass range considered at zi. The solid black line shows the MS at zp, with the magenta, blue, and red dashed lines indicating the boundaries for the SB, star-forming, and passive regions, respectively. Each column focuses on galaxies in different populations at zi (SB, star forming, GV, and passive), while the rows illustrate changes for different redshift pairs (zi, zp). The arrows highlight the quantifiable moves in the M⋆ − SFR.
) that indicates the direction and velocity of galaxy evolution over the time interval elapsed between zp and zi. The arrows are color coded by the progenitor population: SB, star forming, GV, and passive. The width of the arrows is modulated by the relative fraction of sources originating from the respective regions. The head of each arrow corresponds to the galaxy positions at zi, while the tail represents their positions in different regions at zp. The head’s arrow position in each panel is calculated for stellar mass bins equally spaced over the mass range considered at zi. The solid black line shows the MS at zp, with the magenta, blue, and red dashed lines indicating the boundaries for the SB, star-forming, and passive regions, respectively. Each column focuses on galaxies in different populations at zi (SB, star forming, GV, and passive), while the rows illustrate changes for different redshift pairs (zi, zp). The arrows highlight the quantifiable moves in the M⋆ − SFR.
Current usage metrics show cumulative count of Article Views (full-text article views including HTML views, PDF and ePub downloads, according to the available data) and Abstracts Views on Vision4Press platform.
Data correspond to usage on the plateform after 2015. The current usage metrics is available 48-96 hours after online publication and is updated daily on week days.
Initial download of the metrics may take a while.