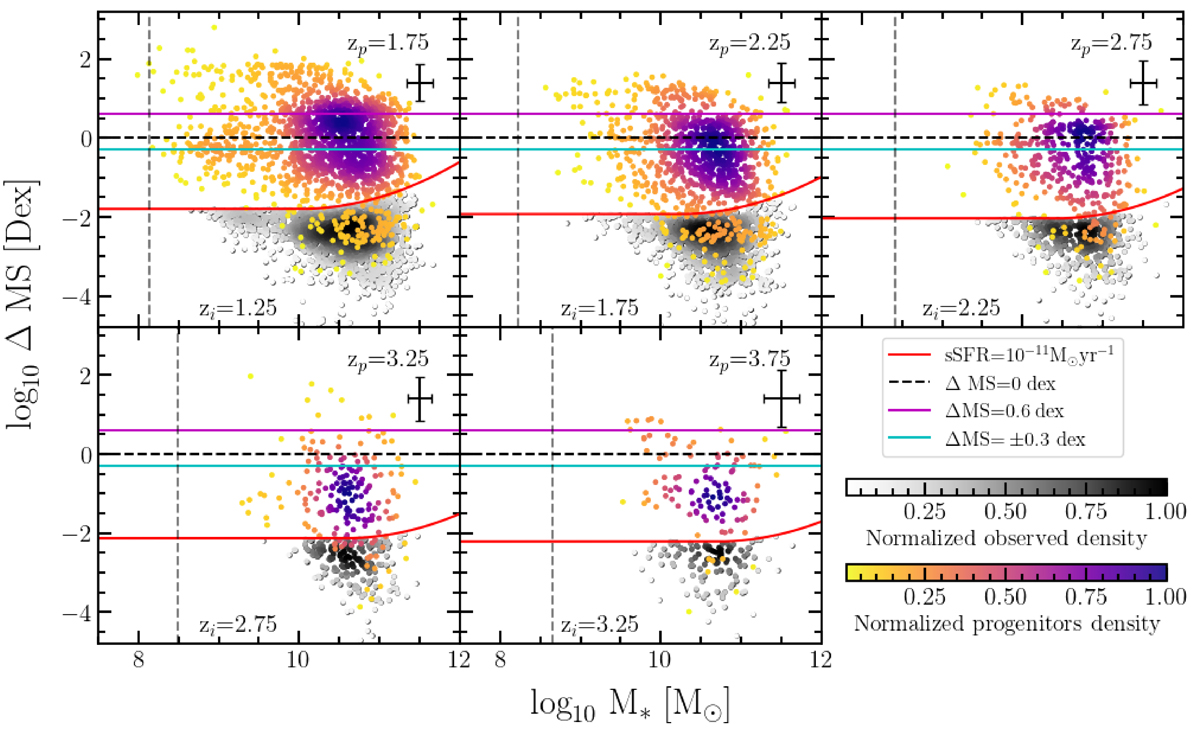
Fig. 18.
Download original image
Distance to the MS (ΔMS) as a function of the stellar mass (in log scales). Shaded black dots represent the observed passive galaxies at zi = {1.25, 1.75, 2.25, 2.75, 3.25}, while color-coded dots (by density over the plane) show the progenitors predicted MS distance at zp = {1.75, 2.25, 2.75, 3.25, 3.57}. Progenitors’ SFR and M⋆ were obtained by computing the expected change in SFR and M⋆ of galaxies at z1. The evolution in time from z2 to z1 over the M⋆ − SFR plane was predicted as in Fig. 17. Cyan solid lines indicate the MS ± 0.3 dex, the magenta solid line the MS + 0.6 dex, and red solid line the sSFR = 10−11 yr−1 limit for passive galaxies. The color bar represents the normalized progenitor’s density over the plane at zp, while the gray color bar shows the normalized observed density of sources at zi.
Current usage metrics show cumulative count of Article Views (full-text article views including HTML views, PDF and ePub downloads, according to the available data) and Abstracts Views on Vision4Press platform.
Data correspond to usage on the plateform after 2015. The current usage metrics is available 48-96 hours after online publication and is updated daily on week days.
Initial download of the metrics may take a while.