Fig. 17.
Download original image
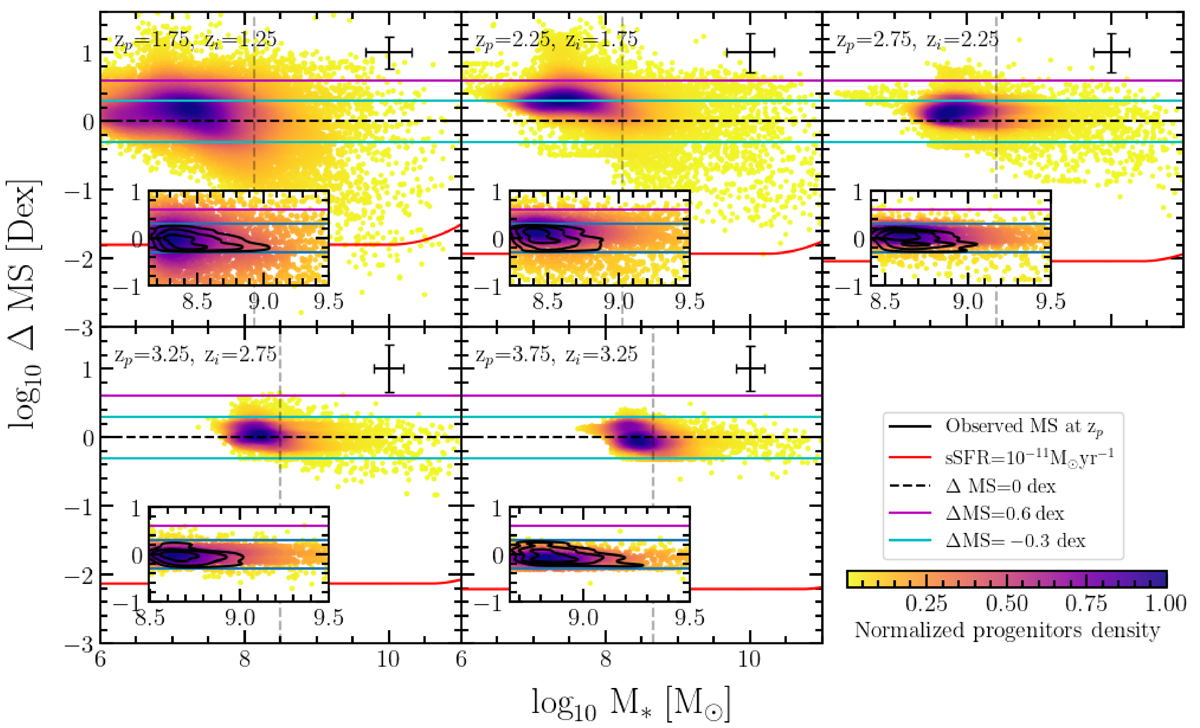
Distance to the MS (ΔMS) as a function of the stellar mass (in log scales). Scatter color-coded points represents the SFR and M⋆ expected for progenitors at zp = {1.75, 2.25, 2.75, 3.25, 3.57} obtained by computing the expected change in SFR and M⋆ of MS galaxies (ΔMS = ±0.3 dex) at zi = {1.25, 1.75, 2.25, 2.75, 3.25}. Black contour lines in the inset panels show the observed (mass complete) MS galaxies at zp. The color bar represents the normalized progenitor density over the plane at zp. The evolution in time of galaxies over the M⋆ − SFR plane is predicted via the ![]() components by computing the change in SFR and M⋆. The dashed lines correspond to the MS of Schreiber et al. (2015) estimated at zp.
components by computing the change in SFR and M⋆. The dashed lines correspond to the MS of Schreiber et al. (2015) estimated at zp.
Current usage metrics show cumulative count of Article Views (full-text article views including HTML views, PDF and ePub downloads, according to the available data) and Abstracts Views on Vision4Press platform.
Data correspond to usage on the plateform after 2015. The current usage metrics is available 48-96 hours after online publication and is updated daily on week days.
Initial download of the metrics may take a while.