Open Access
Fig. 15.
Download original image
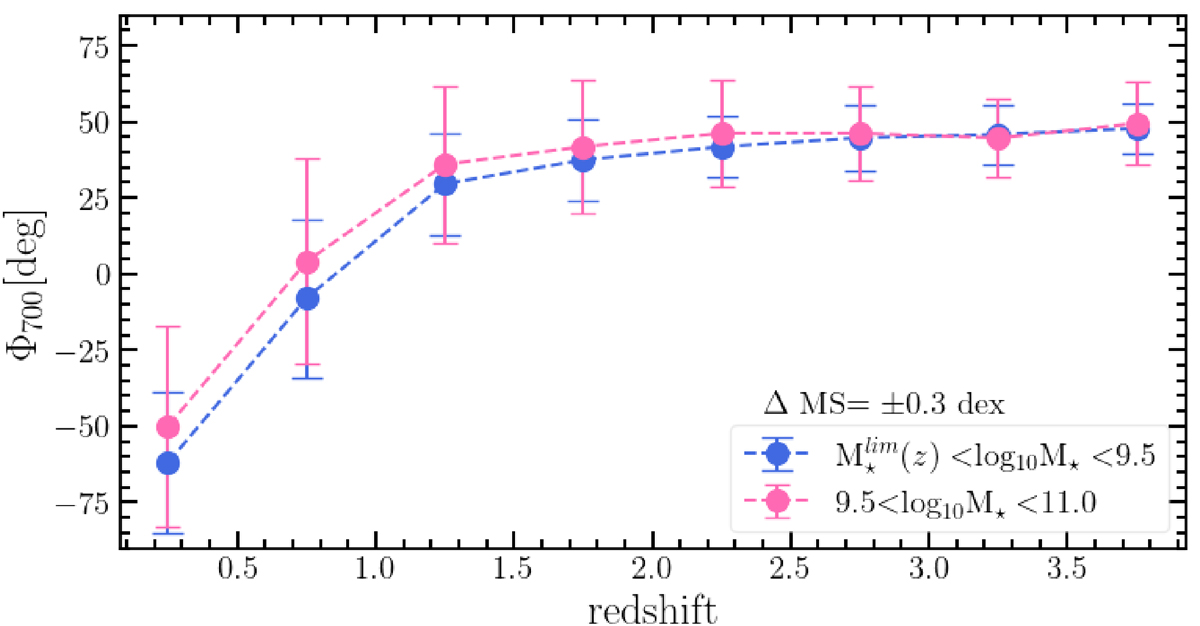
Median migration angle as a function of redshift for MS ± 0.3 dex galaxies. Pink-connected circles indicate galaxies with stellar masses between ![]() , while blue-connected dots indicate galaxies with stellar masses between 9.5 < log10M⋆ < 11.0. Error bars show the dispersion on the migration angle.
, while blue-connected dots indicate galaxies with stellar masses between 9.5 < log10M⋆ < 11.0. Error bars show the dispersion on the migration angle.
Current usage metrics show cumulative count of Article Views (full-text article views including HTML views, PDF and ePub downloads, according to the available data) and Abstracts Views on Vision4Press platform.
Data correspond to usage on the plateform after 2015. The current usage metrics is available 48-96 hours after online publication and is updated daily on week days.
Initial download of the metrics may take a while.