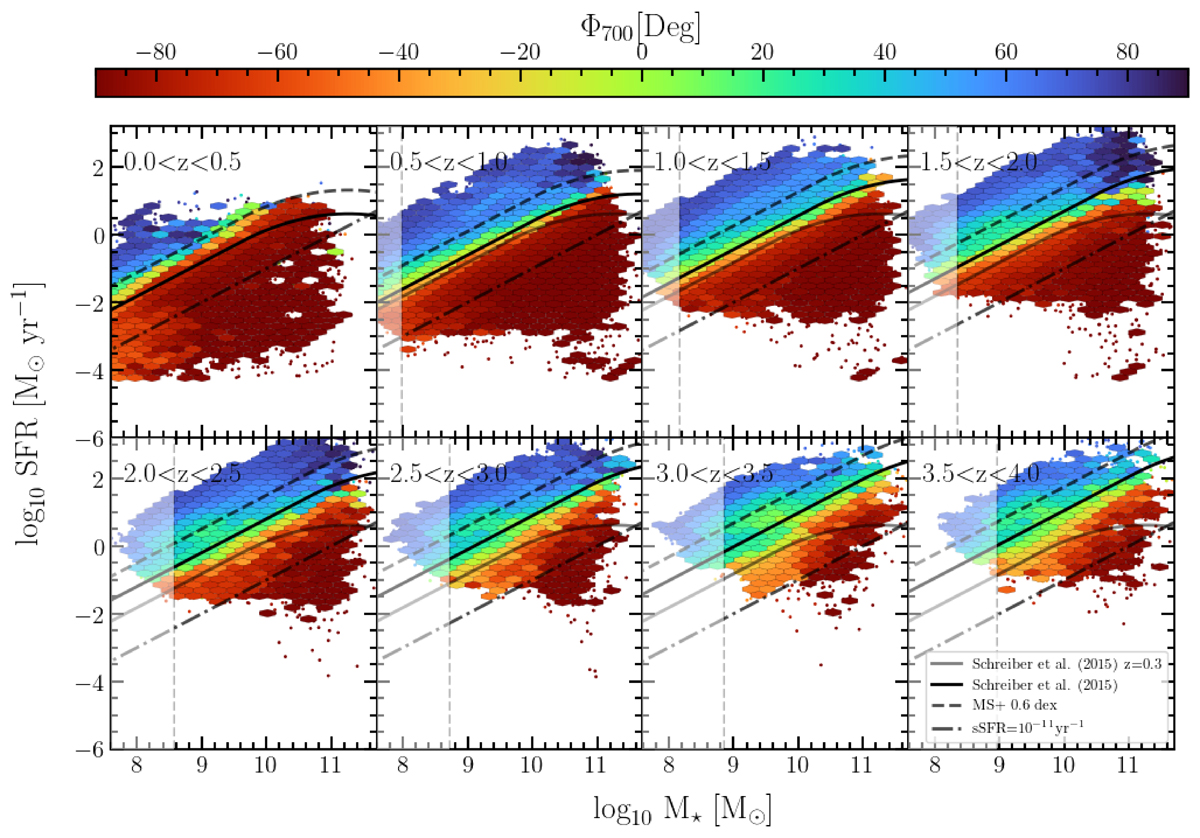
Fig. 10.
Download original image
Plane of M⋆ − SFR in different redshift bins from z = 0 to z = 4. The color code indicates the median value on ΦΔt with Δt = 700 Myr and binned in hexagonal 2D cells. The black solid line presents the MS from the model of Schreiber et al. (2015) at each redshift. In each panel, the gray solid line shows the MS model at z = 0.25. The dot-dashed and dashed lines indicate the limit to select passive and SB galaxies.
Current usage metrics show cumulative count of Article Views (full-text article views including HTML views, PDF and ePub downloads, according to the available data) and Abstracts Views on Vision4Press platform.
Data correspond to usage on the plateform after 2015. The current usage metrics is available 48-96 hours after online publication and is updated daily on week days.
Initial download of the metrics may take a while.