Fig. 7
Download original image
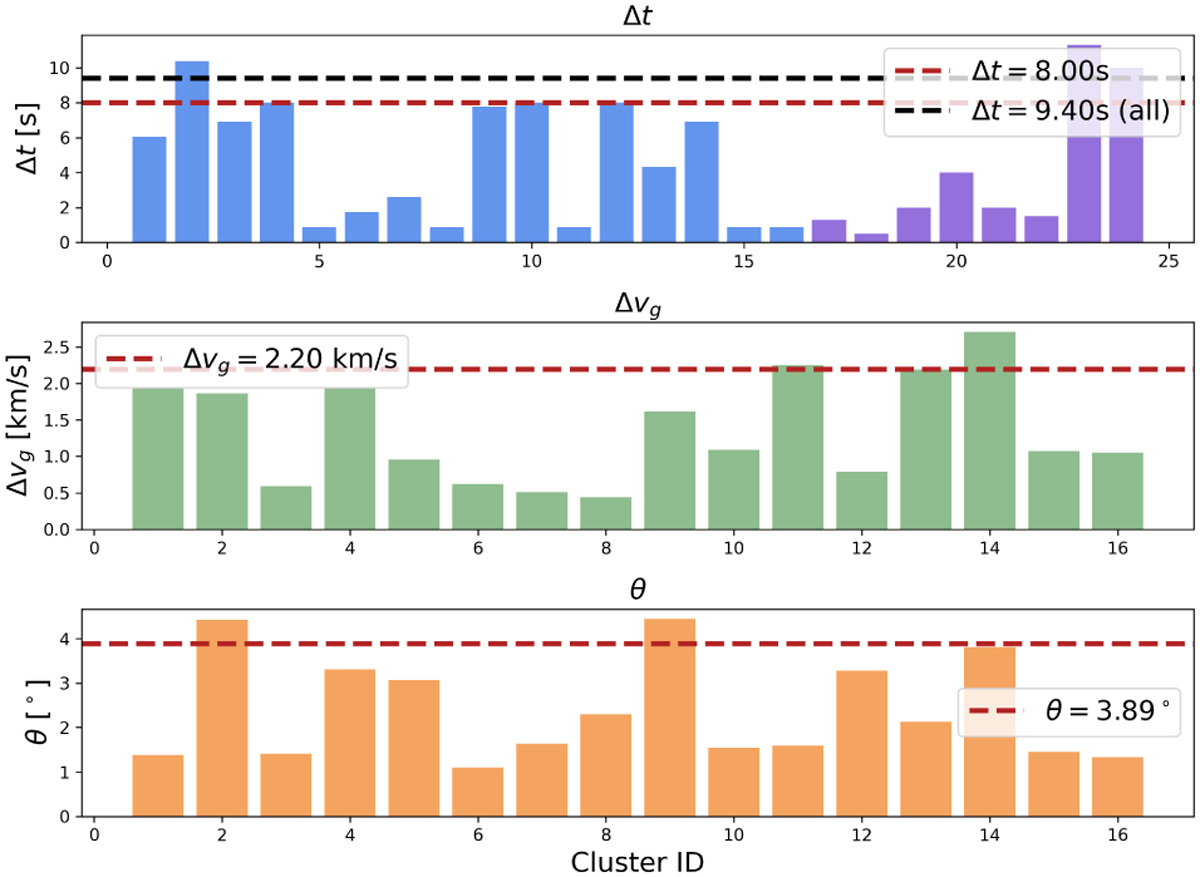
Distributions of the parameters of high-confidence clusters, where Δt is the maximum time separation, Δυɡ is the maximum velocity separation between cluster fragments, and θ is the maximum angular separation between their geocentric radiants. The dashed red lines represent the 90 th percentiles of the dataset. In the topmost subplot, the blue bars represent the 16 clusters detected by us and the purple bars represent the eight confirmed clusters; the dashed black line represents the 90 th percentile for the two sets combined.
Current usage metrics show cumulative count of Article Views (full-text article views including HTML views, PDF and ePub downloads, according to the available data) and Abstracts Views on Vision4Press platform.
Data correspond to usage on the plateform after 2015. The current usage metrics is available 48-96 hours after online publication and is updated daily on week days.
Initial download of the metrics may take a while.