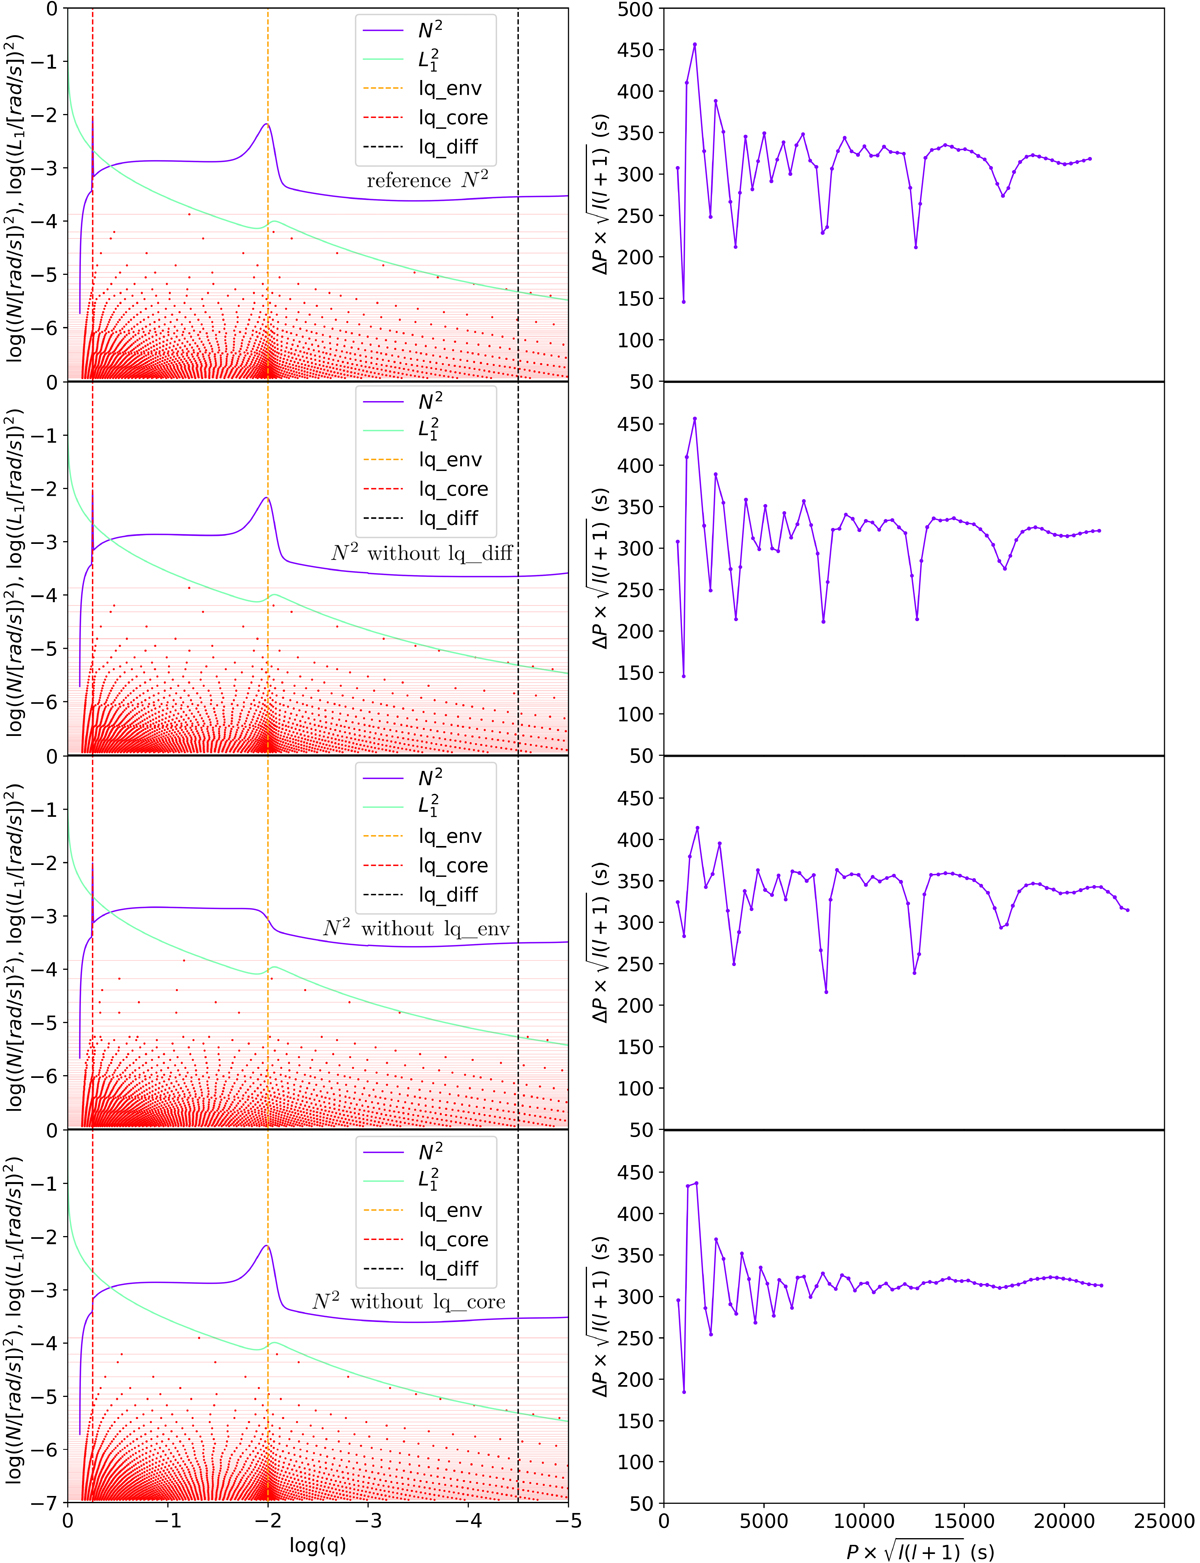
Fig. 7.
Download original image
Influence of removing chemical gradients at lq_core, lq_env, and lq_diff on a 4G model having M* = 0.47 M⊙, lq_core = −0.25, lq_env = −2, and X(He)core = 0.9. Left panels show the logarithm of the square of the Brunt-Väisälä frequency (log N2, blue) and the logarithm of the square of the Lamb frequency for ℓ = 1 (log L12, green) between log(q) = 0 and −5, for the reference model (left panel, first row), when lq_diff is removed (left panel, second row), when lq_env is removed (left panel, third row), and when lq_core is removed (left panel, fourth row). The red dotted vertical line is the lq_core (core-mantle) transition, the orange dotted vertical line is the lq_env (mantle-envelope) transition, and the black dotted line is the lq_diff (envelope of H+He/envelope of pure H) transition. Red horizontal lines are the log(σ2) of each mode and red dots indicate the radial node positions in log(q). Right panels show the pulsation spectrum associated to the models of the left panels, presented as the reduced period spacing (![]() ) as a function of the reduced period (
) as a function of the reduced period (![]() ).
).
Current usage metrics show cumulative count of Article Views (full-text article views including HTML views, PDF and ePub downloads, according to the available data) and Abstracts Views on Vision4Press platform.
Data correspond to usage on the plateform after 2015. The current usage metrics is available 48-96 hours after online publication and is updated daily on week days.
Initial download of the metrics may take a while.