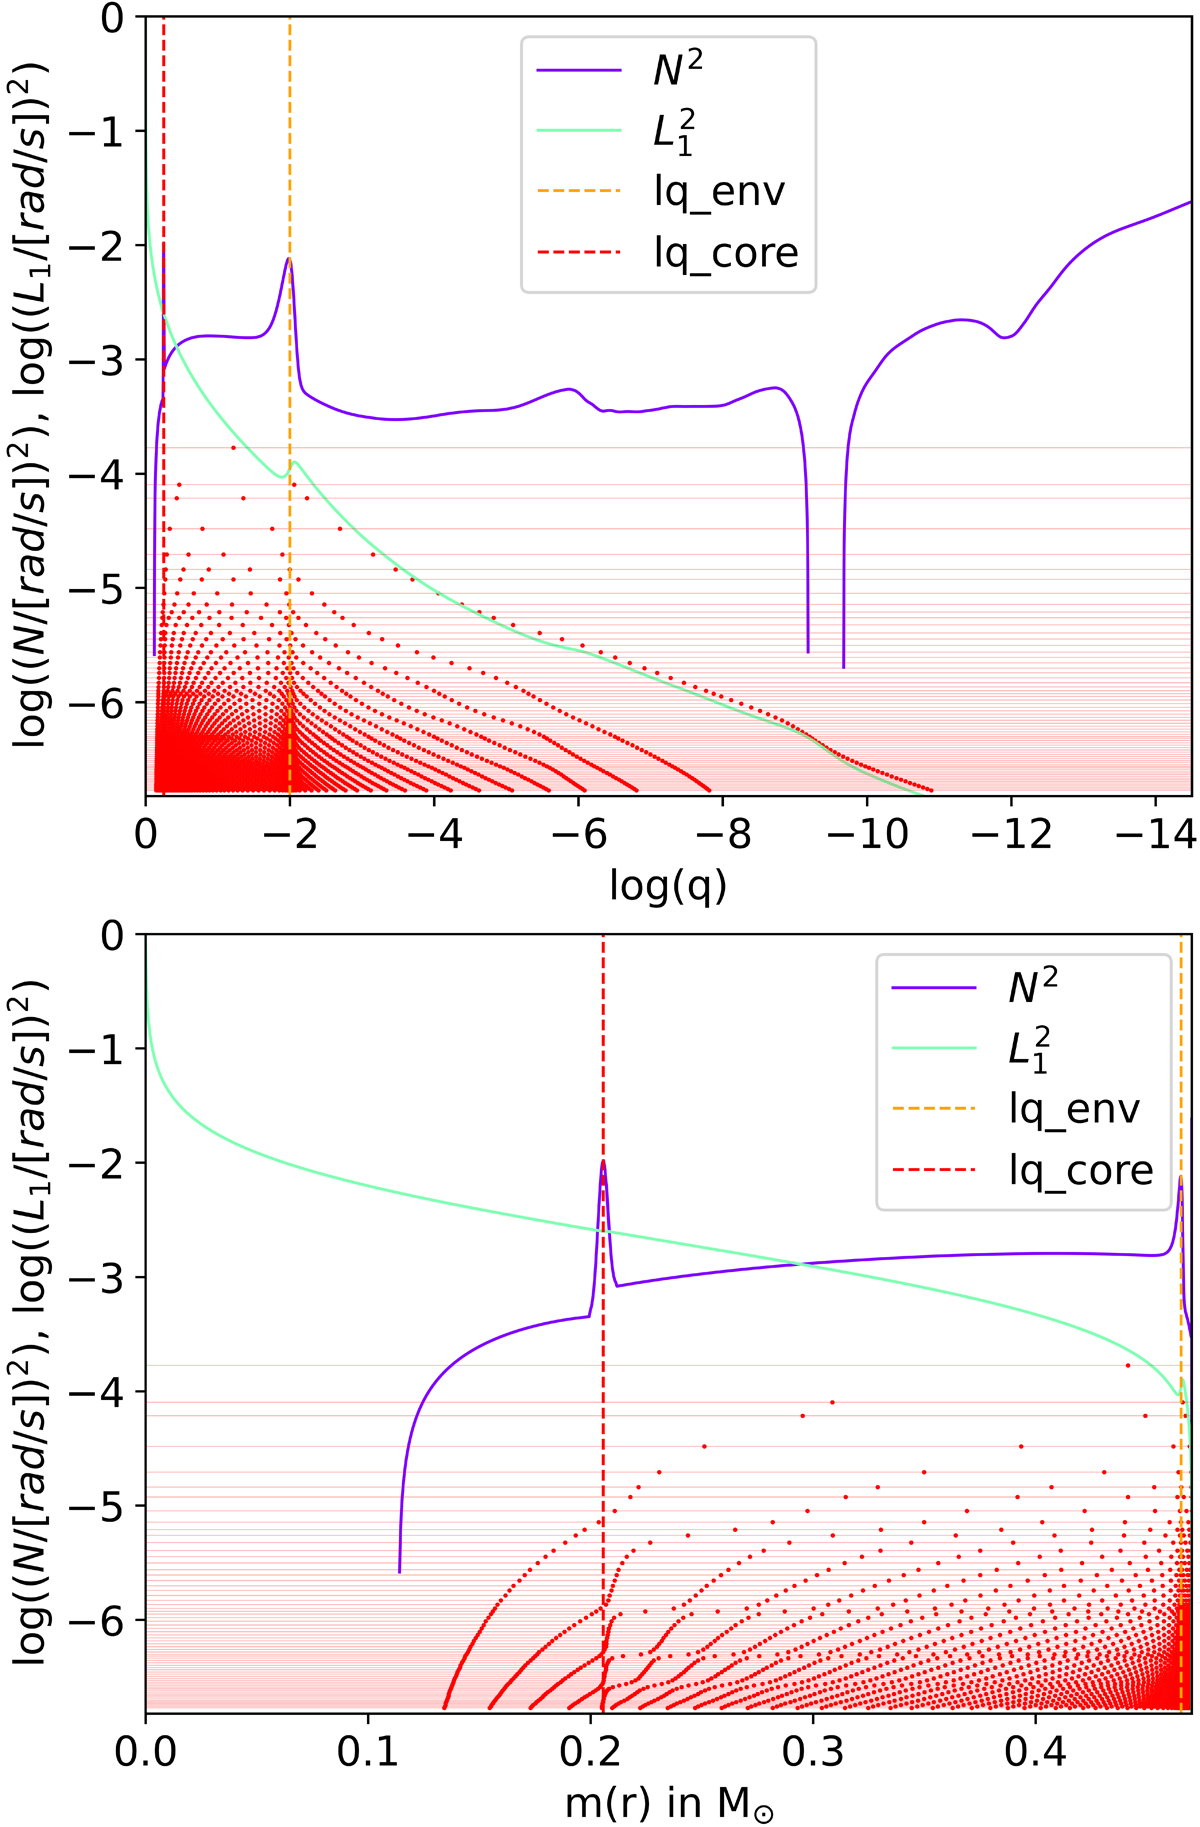
Fig. 6.
Download original image
Propagation diagram of a 4G model having M* = 0.47 M⊙, lq_core = −0.25, lq_env = −2, X(He)core = 0.9, and modes ℓ = 1 ranging from radial order k = 1 to 70. The logarithm of the square of the Brunt-Väisälä frequency (log N2) is depicted in blue and the logarithm of the square of the Lamb frequency for ℓ = 1 (log L12) in green. The red dotted vertical line is the lq_core (core-mantle) transition, and the orange dotted vertical line is the lq_env (mantle-envelope) transition. Red horizontal lines are the log(σ2) of each mode and red dots indicate the radial node positions in log(q).
Current usage metrics show cumulative count of Article Views (full-text article views including HTML views, PDF and ePub downloads, according to the available data) and Abstracts Views on Vision4Press platform.
Data correspond to usage on the plateform after 2015. The current usage metrics is available 48-96 hours after online publication and is updated daily on week days.
Initial download of the metrics may take a while.