Fig. 32.
Download original image
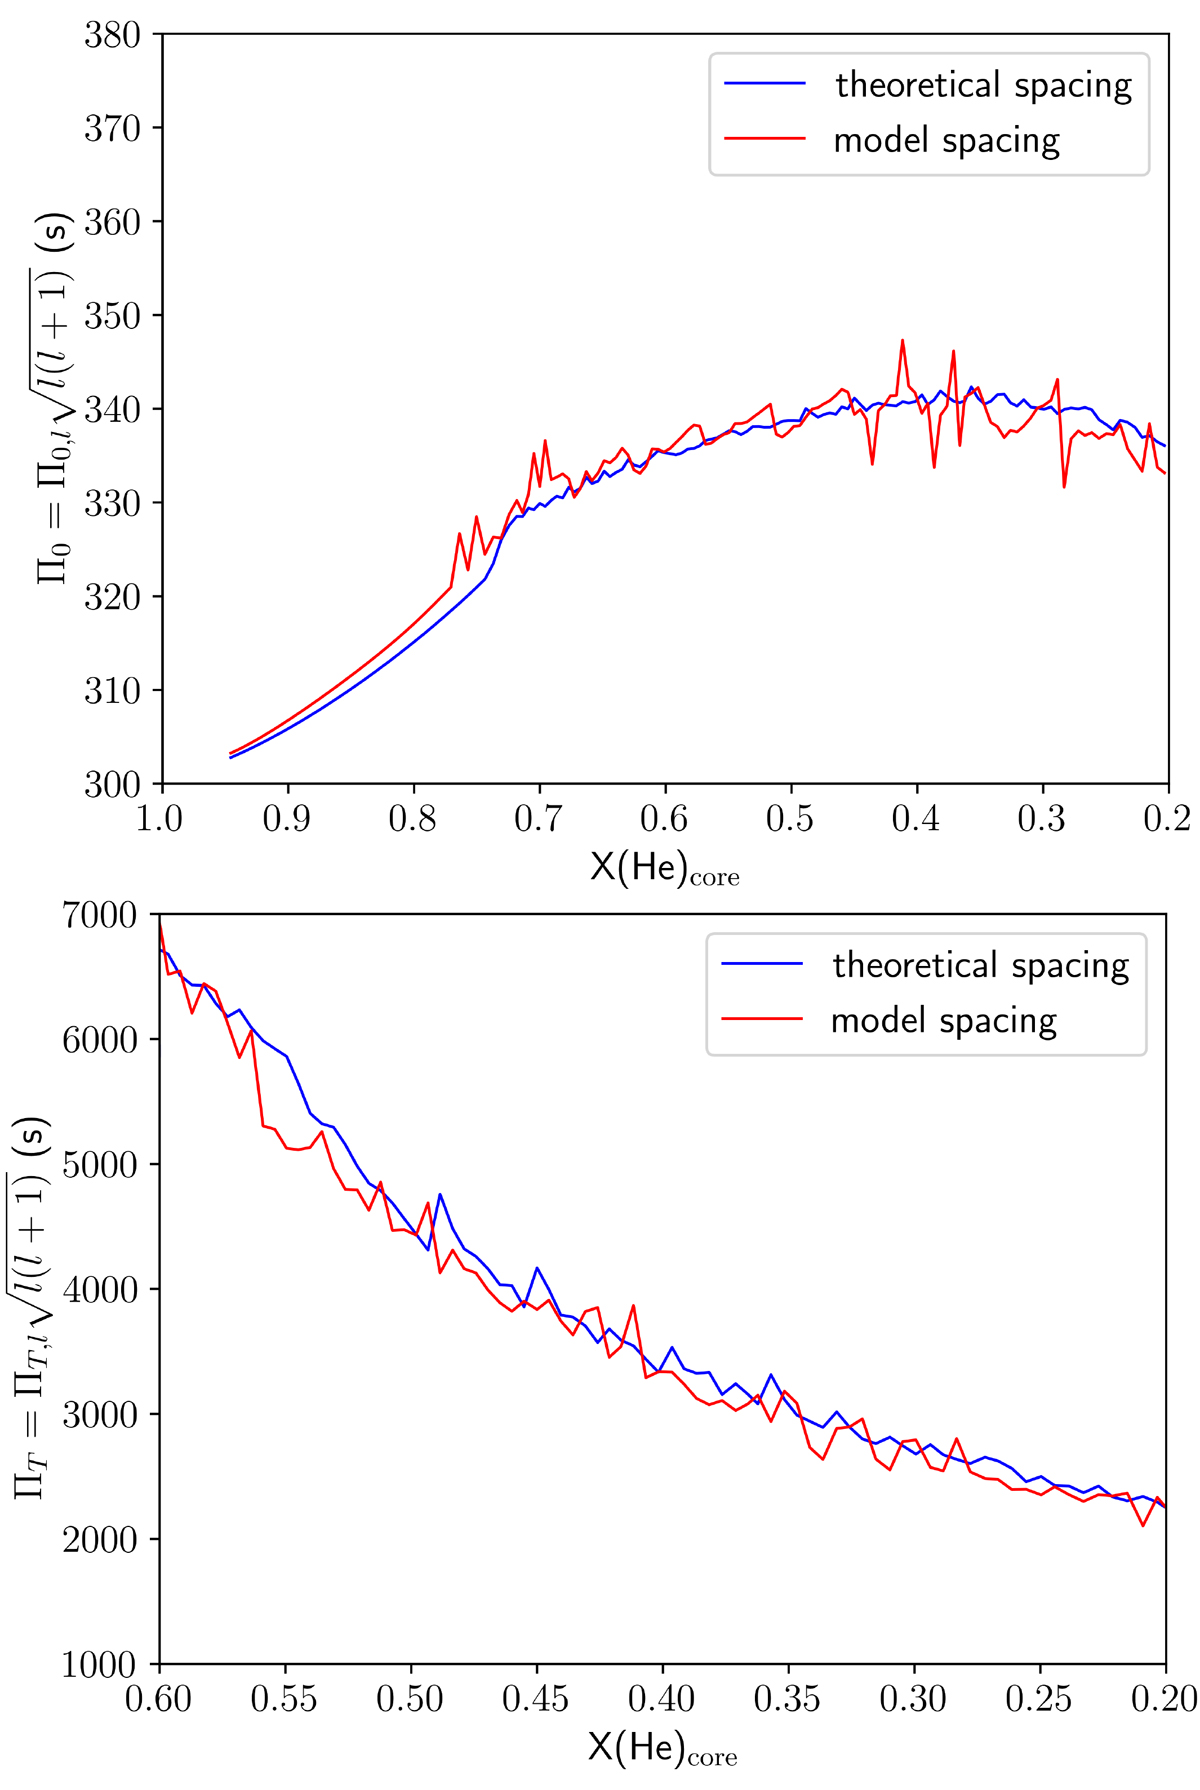
Top panel: Model (red) and theoretical (blue) mean reduced period spacing between two consecutive modes for an evolutionary model at M* = 0.47 M⊙ and lq_env = −2. Bottom panel: Model (red) and theoretical (blue) mean reduced period spacing between two consecutive trapped modes for an evolutionary model at M* = 0.47 M⊙ and lq_env = −2.
Current usage metrics show cumulative count of Article Views (full-text article views including HTML views, PDF and ePub downloads, according to the available data) and Abstracts Views on Vision4Press platform.
Data correspond to usage on the plateform after 2015. The current usage metrics is available 48-96 hours after online publication and is updated daily on week days.
Initial download of the metrics may take a while.