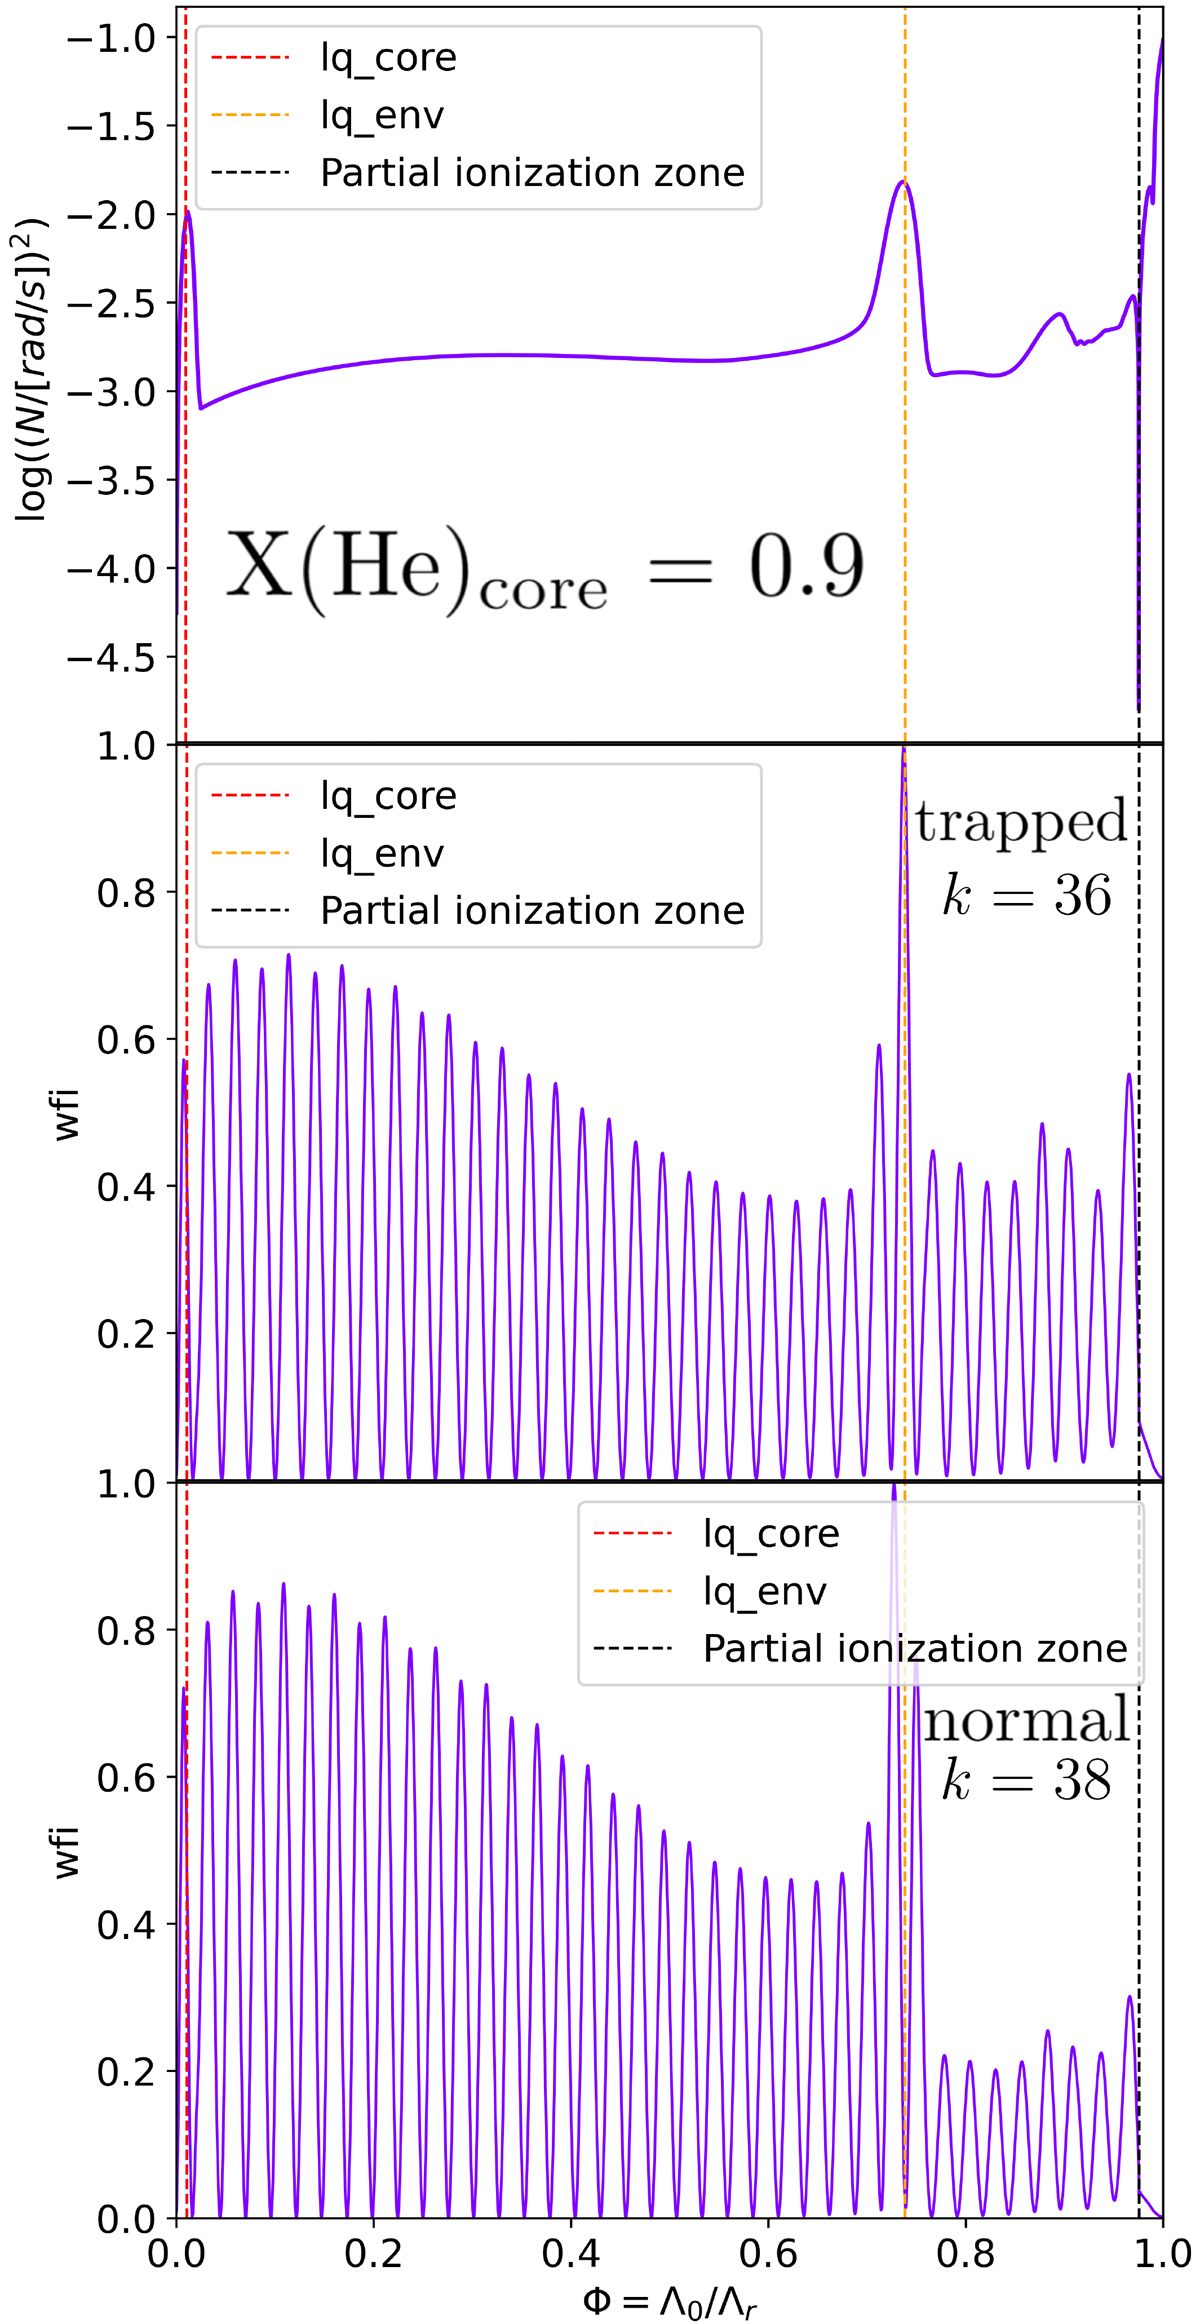
Fig. 24.
Download original image
Top panel: log(N2) as a function of the normalized buoyancy radius (ϕ = Λ0/Λr) at X(He)core = 0.9 for a 4G+ model having M* = 0.47 M⊙, lq_core = −0.25, lq_env = −4, and X(He)core = 0.9. The red dotted vertical line is the lq_core (core-mantle) transition, the orange dotted vertical line is the lq_env (mantle-envelope) transition, and the black dotted vertical line is the bottom of the partial ionization zone of iron. Middle and bottom panels: Weight functions (wfi) of two modes: a mode trapped between lq_env and the bottom of the partial ionization zone (middle) and a normal mode (bottom).
Current usage metrics show cumulative count of Article Views (full-text article views including HTML views, PDF and ePub downloads, according to the available data) and Abstracts Views on Vision4Press platform.
Data correspond to usage on the plateform after 2015. The current usage metrics is available 48-96 hours after online publication and is updated daily on week days.
Initial download of the metrics may take a while.