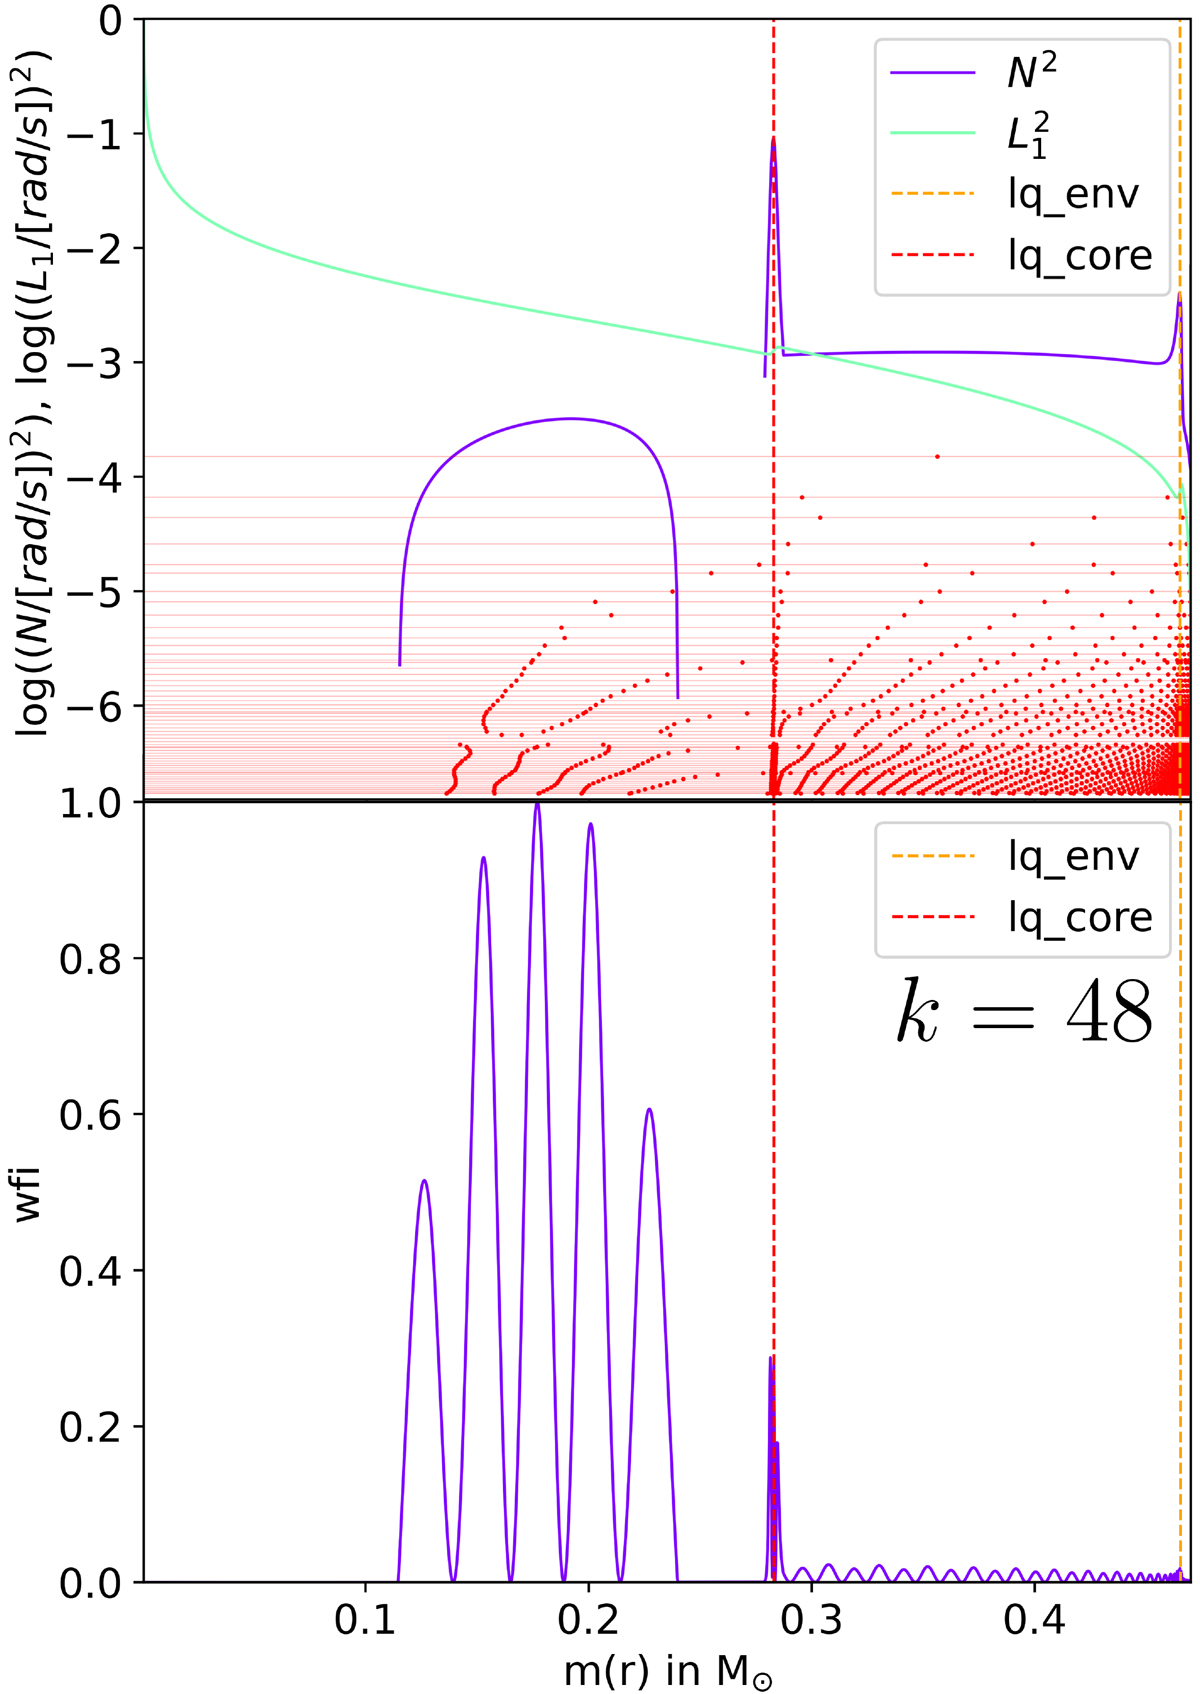
Fig. 15.
Download original image
Top panel: Propagation diagram of a 4G model showing the “radiative arch” due to core splitting for M* = 0.47 M⊙, lq_core =−0.4, lq_env =−2, X(He)core = 0.1. N2 is the Brunt-Väisälä frequency (blue), L1 is the Lamb frequency at ℓ = 1 (green). Red horizontal lines are the log(σ2) of each mode of radial order k = 1 to 70, and red dots indicate the radial node positions in log(q). Bottom panel: Weight function of a mode trapped in the radiative arch, for the same model parameters as the top panel.
Current usage metrics show cumulative count of Article Views (full-text article views including HTML views, PDF and ePub downloads, according to the available data) and Abstracts Views on Vision4Press platform.
Data correspond to usage on the plateform after 2015. The current usage metrics is available 48-96 hours after online publication and is updated daily on week days.
Initial download of the metrics may take a while.