Fig. 6.
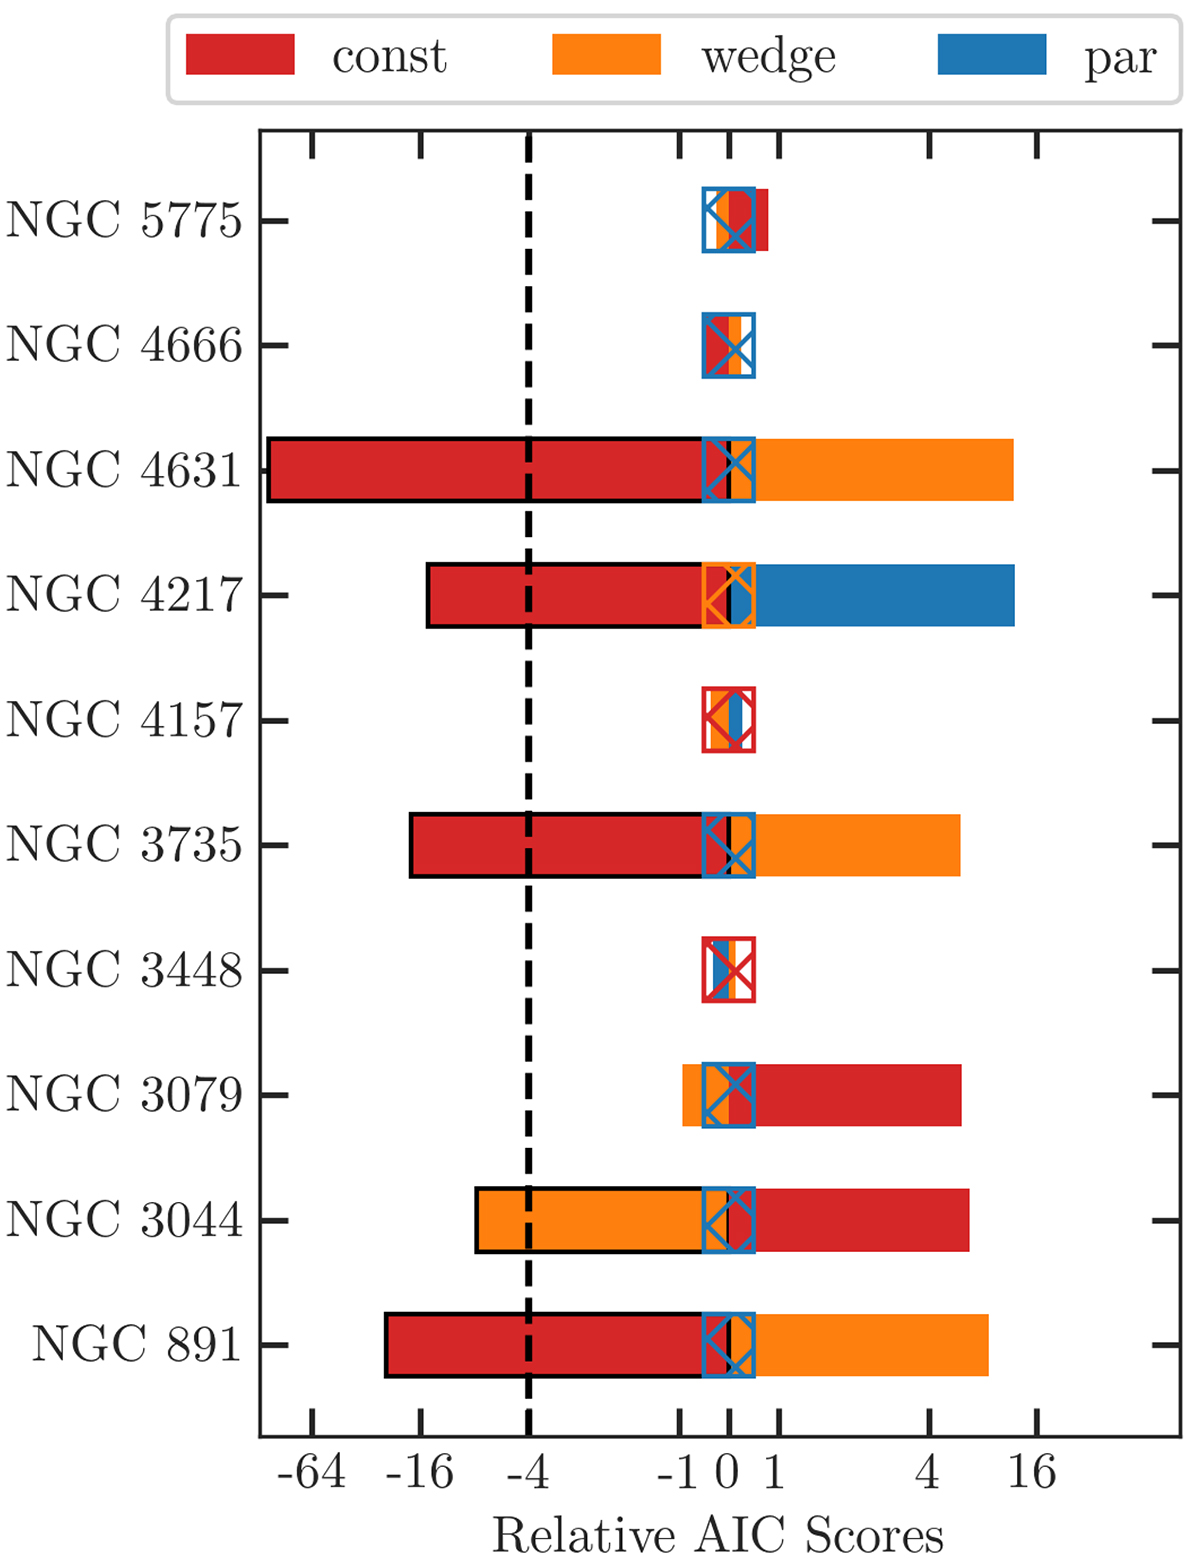
Download original image
AIC score differences for the three tested X shape models (par, wedge, and const). The AIC score differences are computed by using the model with the second lowest AIC score as reference. The reference model is indicated with the hatched box centred on zero. Model scores are highlighted with a black edge if a significant model preference of that model is detected. Here, we choose a threshold |ΔAIC|> 4 (marked as black dashed line) as indication of a model preference (Burnham & Anderson 2002).
Current usage metrics show cumulative count of Article Views (full-text article views including HTML views, PDF and ePub downloads, according to the available data) and Abstracts Views on Vision4Press platform.
Data correspond to usage on the plateform after 2015. The current usage metrics is available 48-96 hours after online publication and is updated daily on week days.
Initial download of the metrics may take a while.