Open Access
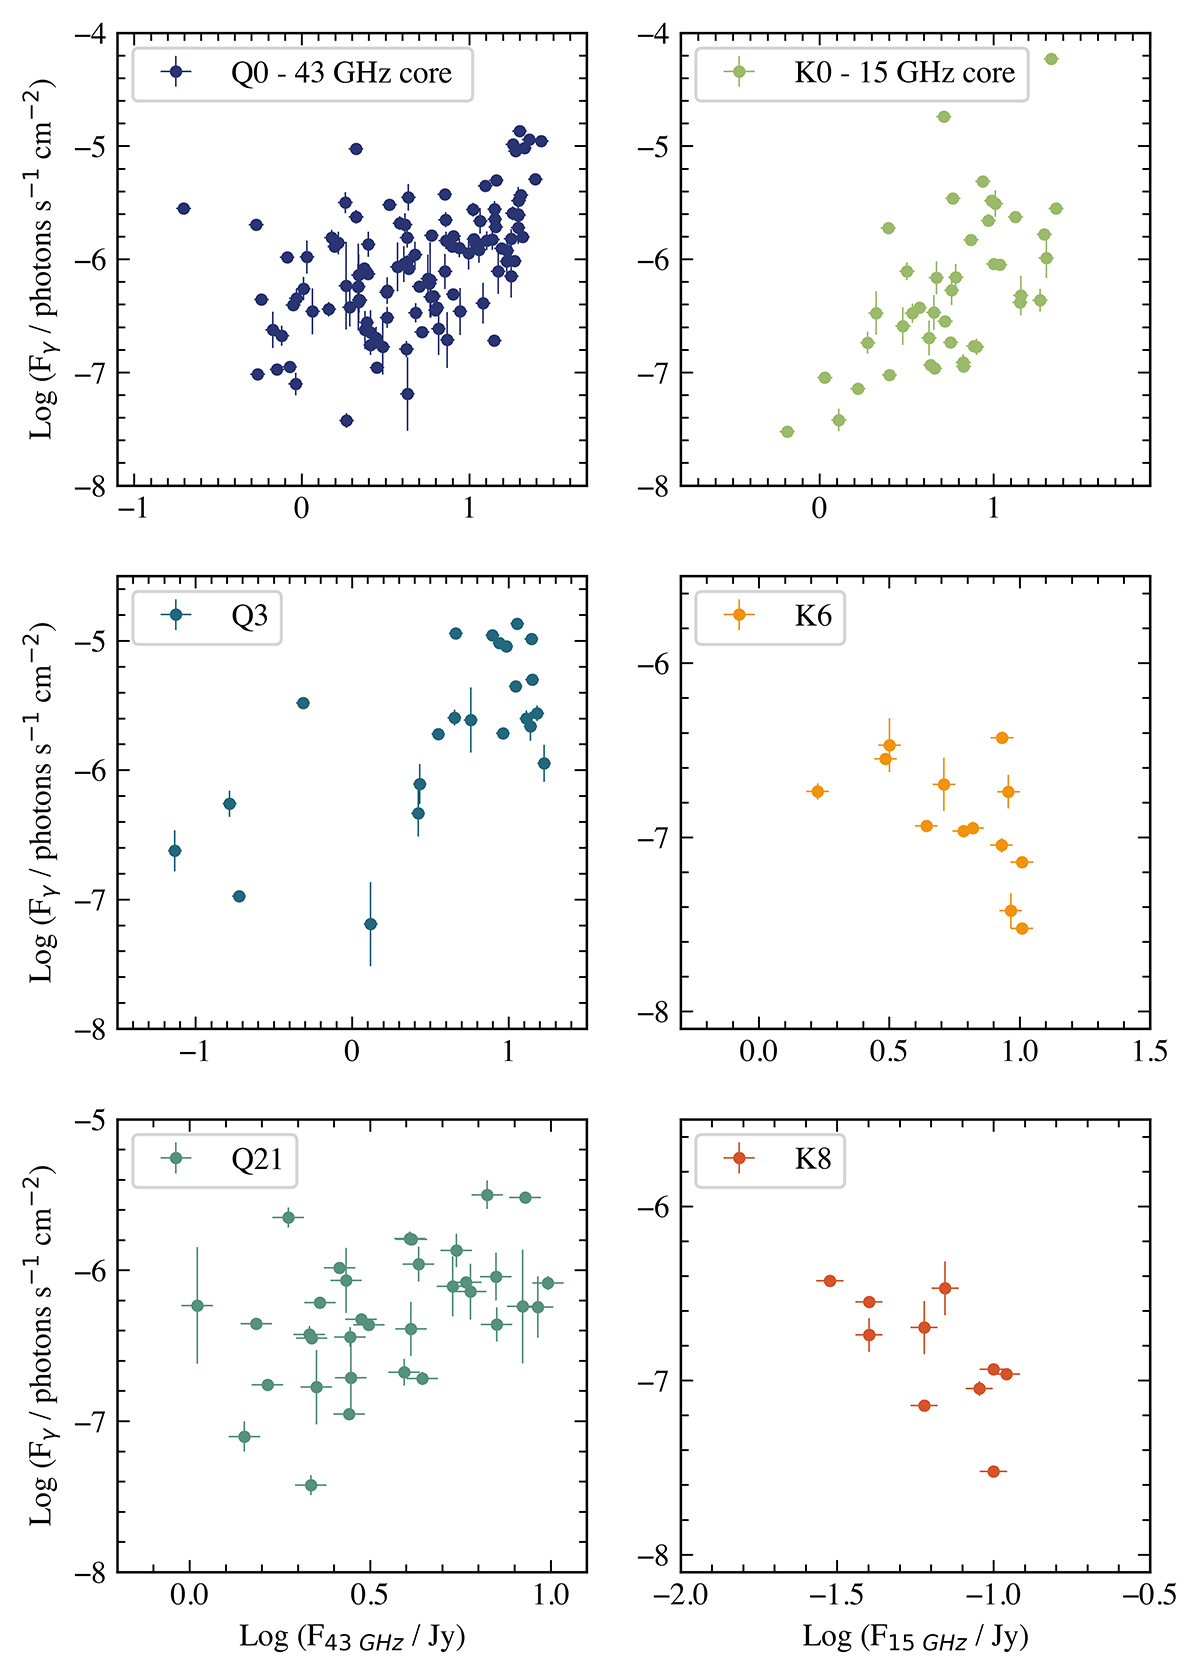
Fig. 6.
Download original image
Plots of γ−flux versus VLBI-flux for the components with significant correlation. Left: γ-ray flux versus 43 GHz flux for the Q0 (core), Q3 and Q21 components in the VLBA maps. Right: γ-ray flux versus 15 GHz flux for the K0 (core), K6 and K8 components.
Current usage metrics show cumulative count of Article Views (full-text article views including HTML views, PDF and ePub downloads, according to the available data) and Abstracts Views on Vision4Press platform.
Data correspond to usage on the plateform after 2015. The current usage metrics is available 48-96 hours after online publication and is updated daily on week days.
Initial download of the metrics may take a while.