Open Access
Fig. 4.
Download original image
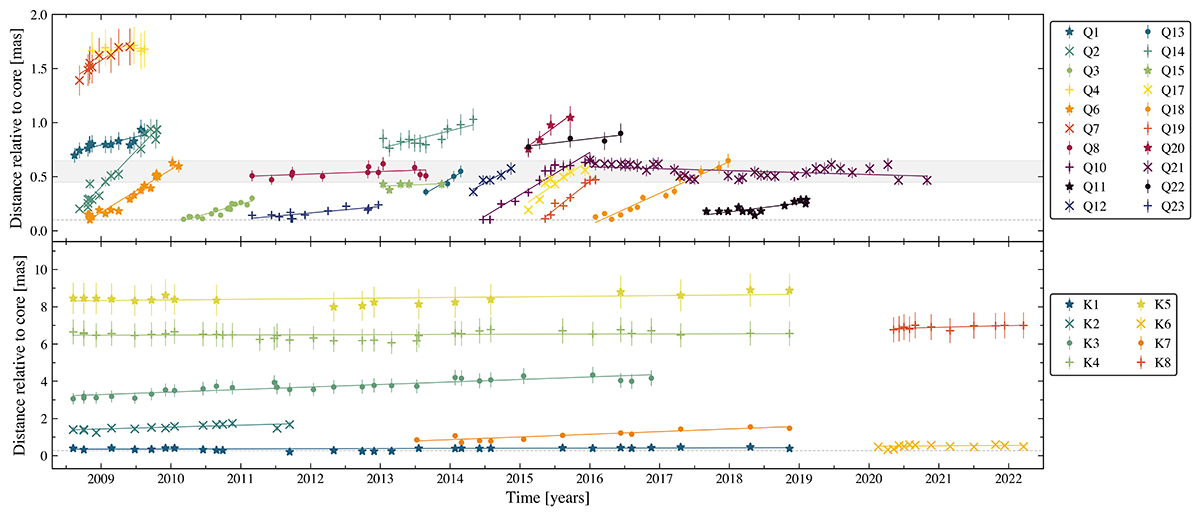
Relative distance to the core versus time of all the identified jet components in 3C 454.3 at 43 GHz (upper panel) and 15 GHz (lower panel). The gray shadowed area represents the position of the quasi-stationary region reported by this and previous studies. The dashed horizontal line shows the typical angular resolution.
Current usage metrics show cumulative count of Article Views (full-text article views including HTML views, PDF and ePub downloads, according to the available data) and Abstracts Views on Vision4Press platform.
Data correspond to usage on the plateform after 2015. The current usage metrics is available 48-96 hours after online publication and is updated daily on week days.
Initial download of the metrics may take a while.