Fig. 2.
Download original image
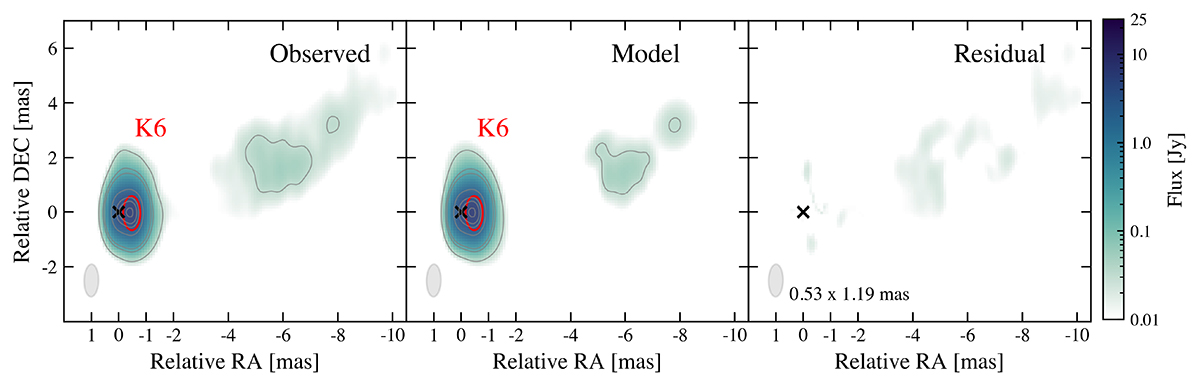
Left panel: VLBA intensity map at 15 GHz showing the position of K6 on November 21, 2020, convolved with a beam of 1.1 × 0.5 mas2 at PA = 1°. Middle panel: Fitting result of the observed emission. Right panel: Residual image. The gray lines correspond to contour levels of 0.5, 3, 5, 30, 60, 75, and 95% of the peak total intensity.
Current usage metrics show cumulative count of Article Views (full-text article views including HTML views, PDF and ePub downloads, according to the available data) and Abstracts Views on Vision4Press platform.
Data correspond to usage on the plateform after 2015. The current usage metrics is available 48-96 hours after online publication and is updated daily on week days.
Initial download of the metrics may take a while.