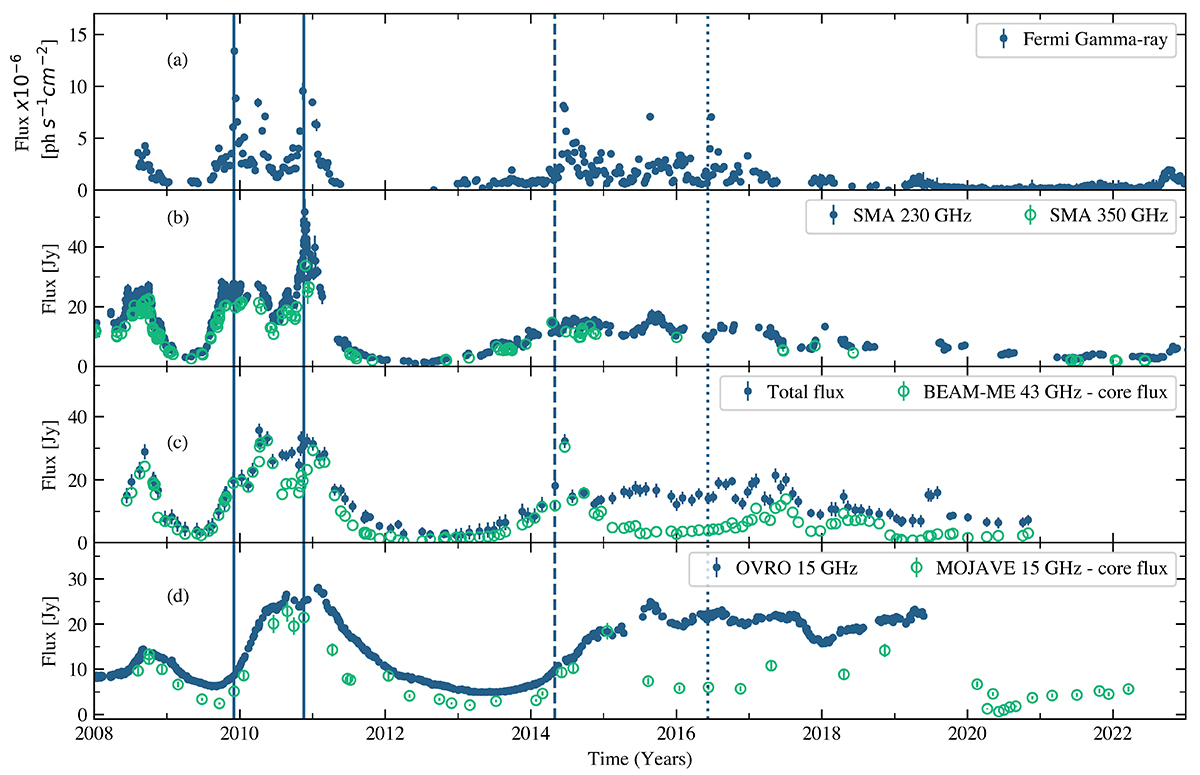
Fig. 1.
Download original image
Multi-wavelength light curves of 3C 454.3. Each panel shows the blazar emission at a different wavelength (indicated by the label and color). The data source is specified within each panel. The solid vertical lines mark γ-ray flare events that appear to coincide with the passage of jet components K09 and K10 through the VLBI core (Jorstad et al. 2013). The dashed vertical line indicates the ejection of a relativistic component from the radio core (K14; Liodakis et al. 2020). The dotted vertical line represents the time at which a knot crossed the 43 GHz core (K16; Weaver et al. 2019).
Current usage metrics show cumulative count of Article Views (full-text article views including HTML views, PDF and ePub downloads, according to the available data) and Abstracts Views on Vision4Press platform.
Data correspond to usage on the plateform after 2015. The current usage metrics is available 48-96 hours after online publication and is updated daily on week days.
Initial download of the metrics may take a while.