Fig. 9.
Download original image
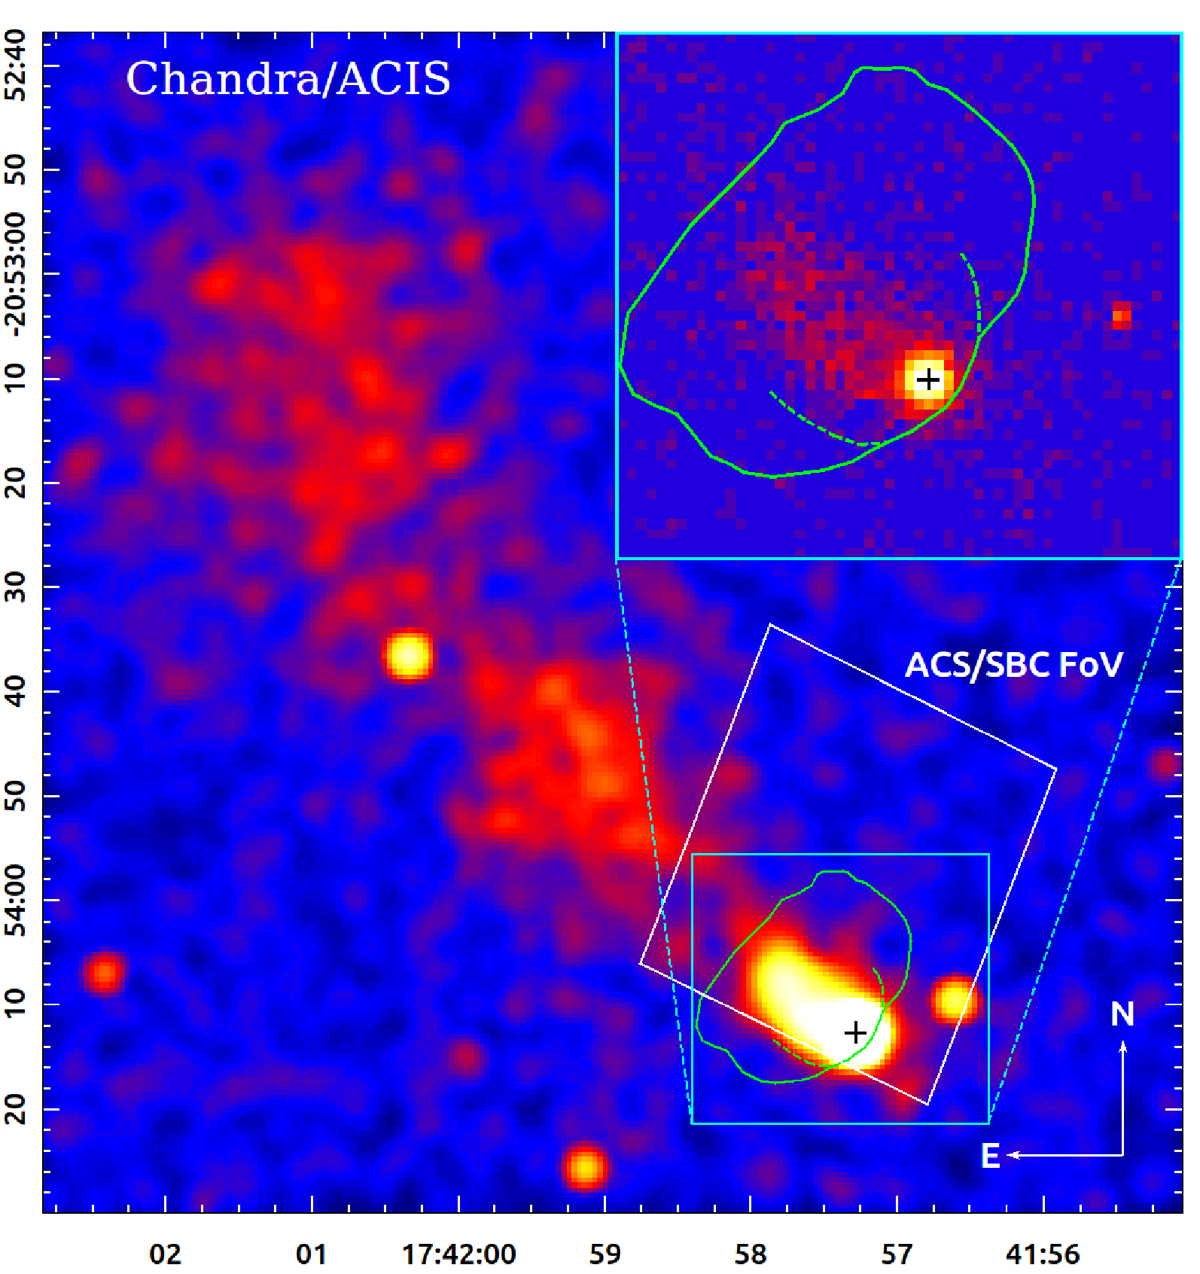
Comparison of the J1741 X-ray PWN and Hα-FUV BSN shapes. The green contour shows the outer boundary of the Hα BSN as imaged by SOAR (see Figure 2), which virtually coincides with outer boundary of the FUV BSN, overlaid on the Chandra ACIS-S 0.7–8 keV image. The large-scale Chandra image is smoothed with a 5 pixel Gaussian kernel, while the zoomed-in 28″ × 26″ image of the compact PWN in the inset is shown without smoothing. The green dashed curves show the continuation of the bulge into the inner BSN region. The black cross shows the pulsar position.
Current usage metrics show cumulative count of Article Views (full-text article views including HTML views, PDF and ePub downloads, according to the available data) and Abstracts Views on Vision4Press platform.
Data correspond to usage on the plateform after 2015. The current usage metrics is available 48-96 hours after online publication and is updated daily on week days.
Initial download of the metrics may take a while.