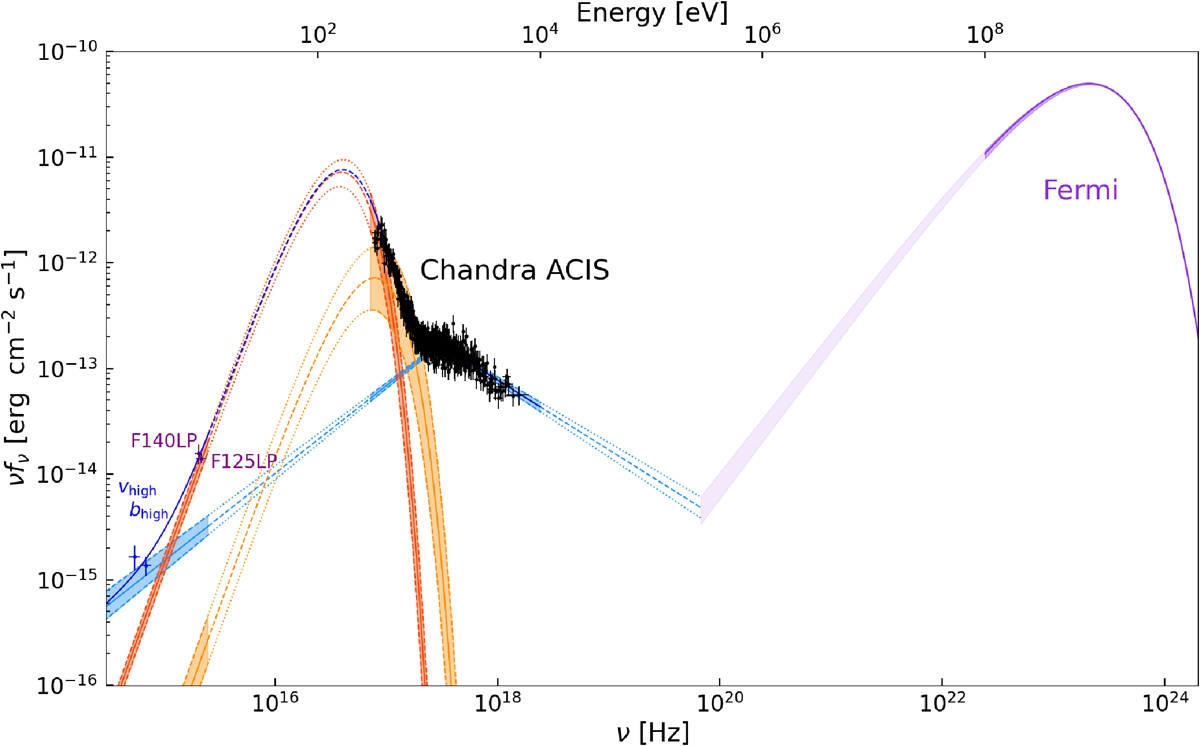
Fig. 7.
Download original image
SED for the unabsorbed optical through γ-ray emission from J1741. The cold BB, hot BB, and broken PL model components are shown by red-orange, orange, and blue lines, respectively, the corresponding shaded areas show the 1σ uncertainties of the model components in the ranges where the pulsar was observed. The purple lines and shaded area show the γ-ray model and its 1σ uncertainties, whereas the light purple shaded area shows the continuation of the γ-ray model toward lower energies. The blue solid line shows the best-fit model to the optical-UV and X-ray data.
Current usage metrics show cumulative count of Article Views (full-text article views including HTML views, PDF and ePub downloads, according to the available data) and Abstracts Views on Vision4Press platform.
Data correspond to usage on the plateform after 2015. The current usage metrics is available 48-96 hours after online publication and is updated daily on week days.
Initial download of the metrics may take a while.