Fig. 5.
Download original image
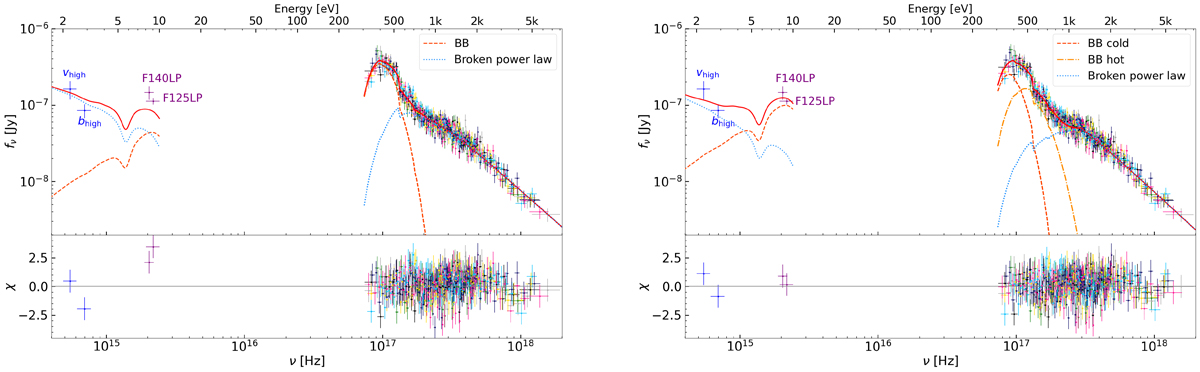
Observed optical-FUV and X-ray spectra of J1741 fitted with the absorbed brPL + BB (left) and brPL + BB + BB (right) models. The blue and violet data points show the VLT optical and HST FUV data, respectively, while the seven separate X-ray data sets from Chandra observations (see Table 1 in Auchettl et al. (2015)) are shown in different colors. The solid red lines show the best-fit models (see text and Figure 6 for the best-fit parameters), whereas the red dashed, orange dot-dashed, and blue dotted lines show model components, as indicated in the legends. The fit residuals shown in the bottom subpanels are defined as χ ≡ (data − model)/error.
Current usage metrics show cumulative count of Article Views (full-text article views including HTML views, PDF and ePub downloads, according to the available data) and Abstracts Views on Vision4Press platform.
Data correspond to usage on the plateform after 2015. The current usage metrics is available 48-96 hours after online publication and is updated daily on week days.
Initial download of the metrics may take a while.