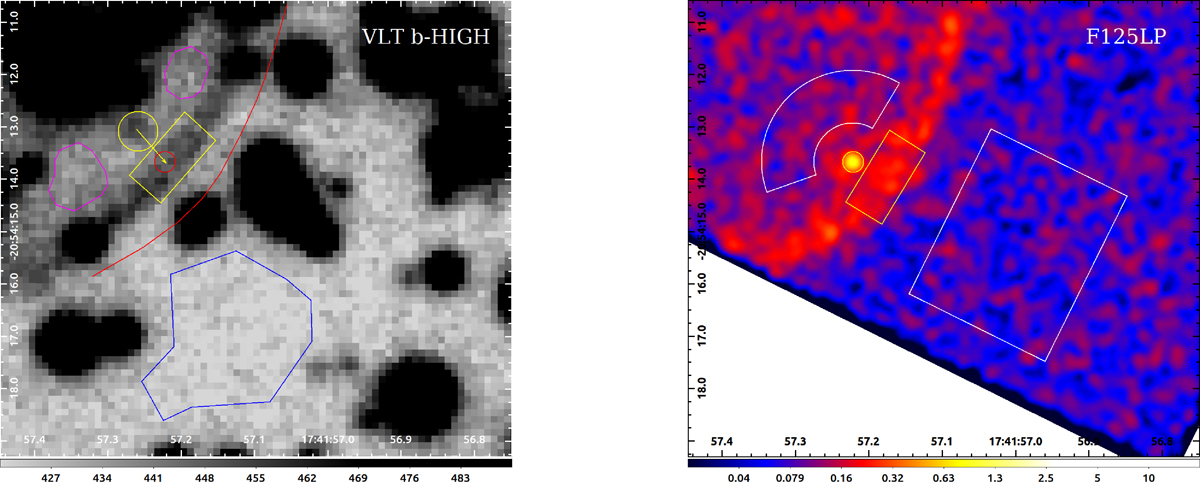
Fig. 3.
Download original image
VLT bhigh (MJD 57156) and HST F125LP (MJD 60107) images of the pulsar vicinity. The yellow rectangular regions were used for the measurements of surface brightness of the BSN apex in the HST and VLT images. The yellow circles show apertures used for the pulsar counterpart flux measurements in the HST and VLT images, while the yellow arrow shows the proper motion shift of the pulsar between the epochs of 2015 and 2023. The red circle in the VLT image shows the pulsar counterpart position from the HST F125LP image. The purple contours in the VLT image show the areas in which the background for pulsar counterpart was estimated, while the blue contour shows the background for the BSN apex. The white segment of annulus and the white box in the F125LP image show the background area for the pulsar counterpart and the BSN apex, respectively. In all cases a set of apertures (circular or rectangular) was randomly generated inside the background area to estimate the mean and standard deviation of the background count rate. The red line in the VLT image shows the position of BSN outer boundary from the HST image.
Current usage metrics show cumulative count of Article Views (full-text article views including HTML views, PDF and ePub downloads, according to the available data) and Abstracts Views on Vision4Press platform.
Data correspond to usage on the plateform after 2015. The current usage metrics is available 48-96 hours after online publication and is updated daily on week days.
Initial download of the metrics may take a while.