Fig. 1.
Download original image
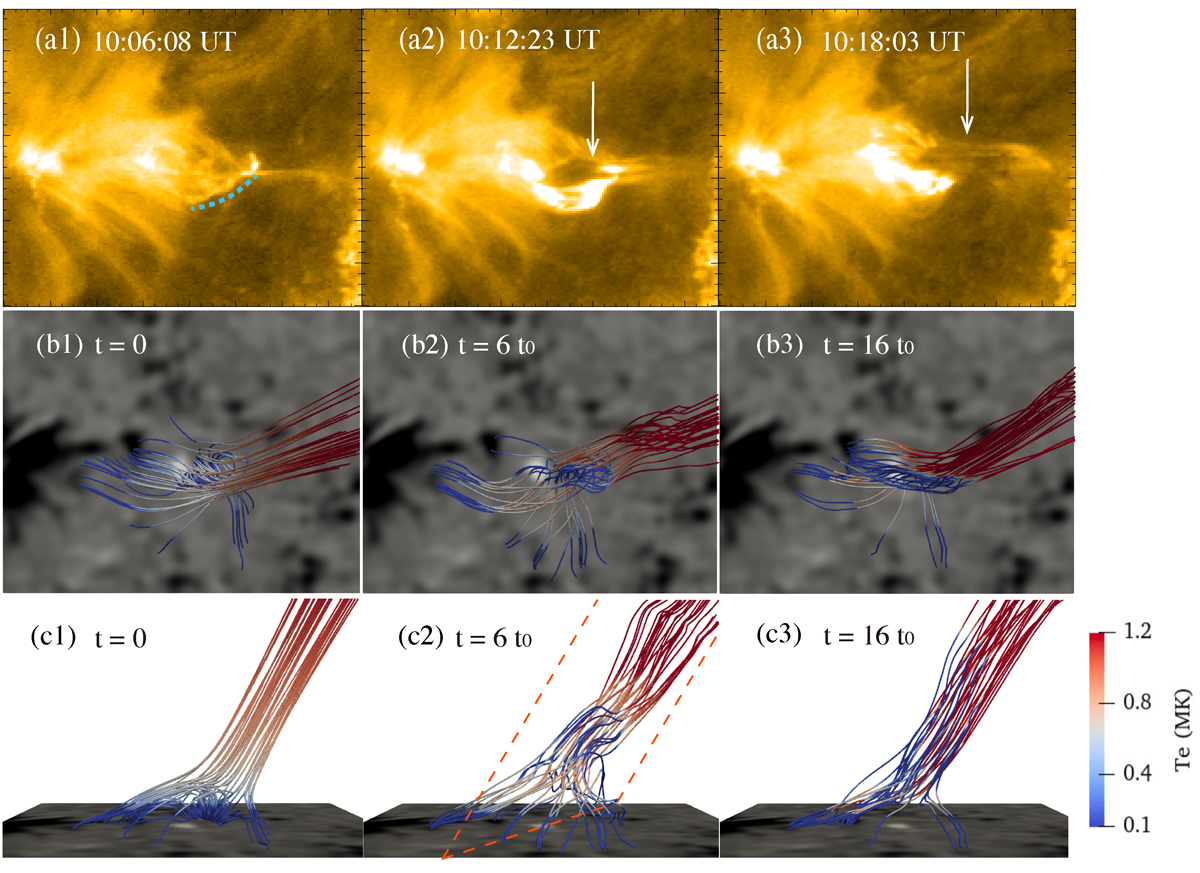
Comparison between observations and simulations at three instances. (a) EUI 174 Å images displaying the temporal evolution of the spiral jet eruption with arrows indicating dark threads. The blue dashed curve in panel a1 indicates the path of the inserted flux rope. (b) Temporal evolution of 3D magnetic field lines as viewed from the top. (c) Same as panel b, but as viewed from the side. The lines in blue and red correspond to cold and warm plasma, respectively. The red dashed lines indicate the plane in Fig. C.1.
Current usage metrics show cumulative count of Article Views (full-text article views including HTML views, PDF and ePub downloads, according to the available data) and Abstracts Views on Vision4Press platform.
Data correspond to usage on the plateform after 2015. The current usage metrics is available 48-96 hours after online publication and is updated daily on week days.
Initial download of the metrics may take a while.