Open Access
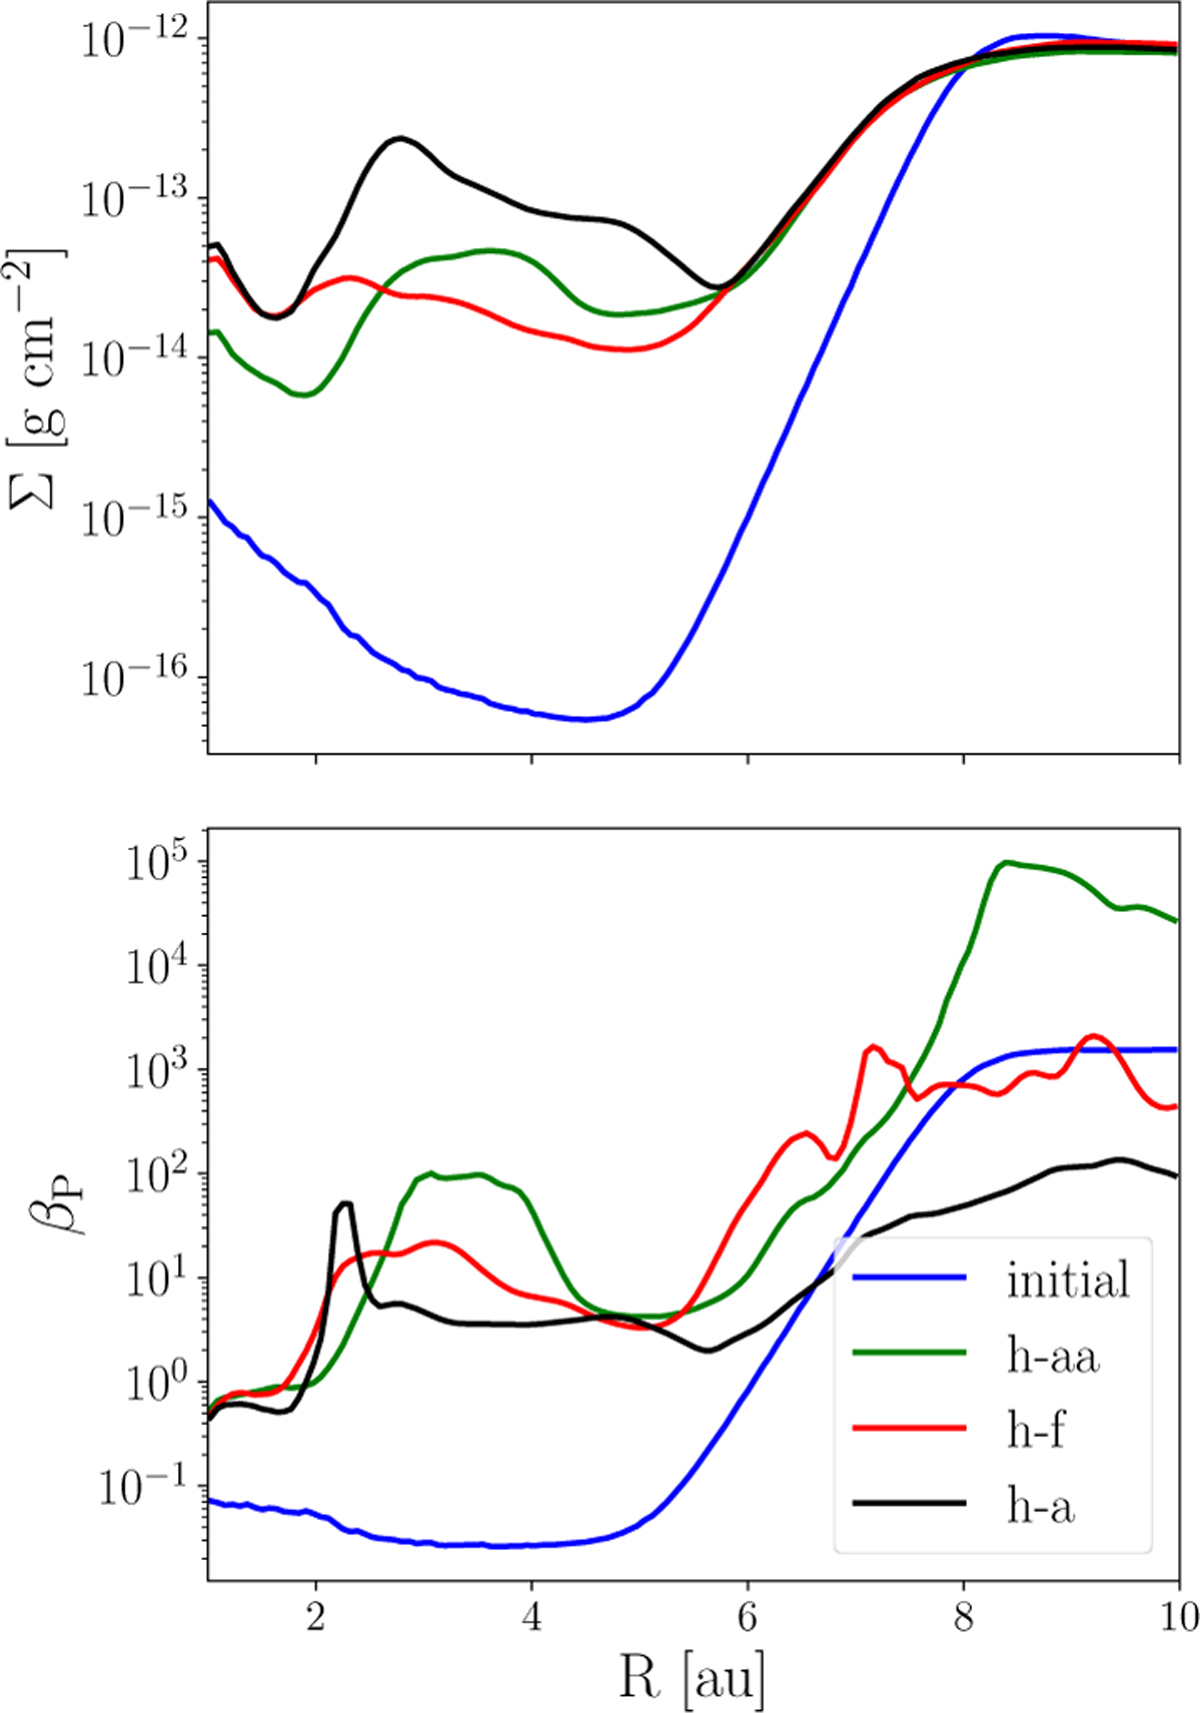
Fig. 7
Download original image
Comparison of the vertically averaged surface density (top) and plasma parameter βP (bottom panel) over radius for the three runs. The initial profile (blue) is common for all models, the other lines are time averaged.
Current usage metrics show cumulative count of Article Views (full-text article views including HTML views, PDF and ePub downloads, according to the available data) and Abstracts Views on Vision4Press platform.
Data correspond to usage on the plateform after 2015. The current usage metrics is available 48-96 hours after online publication and is updated daily on week days.
Initial download of the metrics may take a while.