Open Access
Fig. 5
Download original image
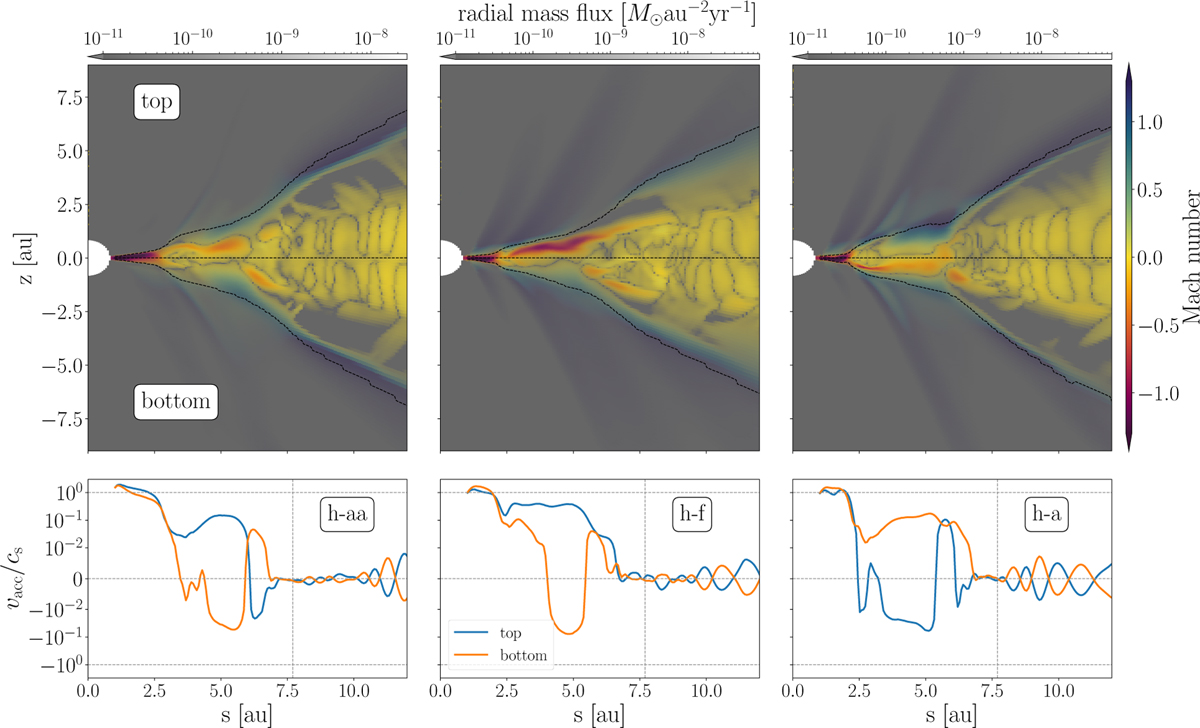
Time-averaged snapshot of the flow Mach number over 100yr (upper panels) and normalized accretion velocity profiles (lower panels) for the three runs. On the snapshots we are overlaying the radial mass flux using a gray alpha gradient colormap. The black dashed lines indicate the disk midplane as well as the disk surface.
Current usage metrics show cumulative count of Article Views (full-text article views including HTML views, PDF and ePub downloads, according to the available data) and Abstracts Views on Vision4Press platform.
Data correspond to usage on the plateform after 2015. The current usage metrics is available 48-96 hours after online publication and is updated daily on week days.
Initial download of the metrics may take a while.