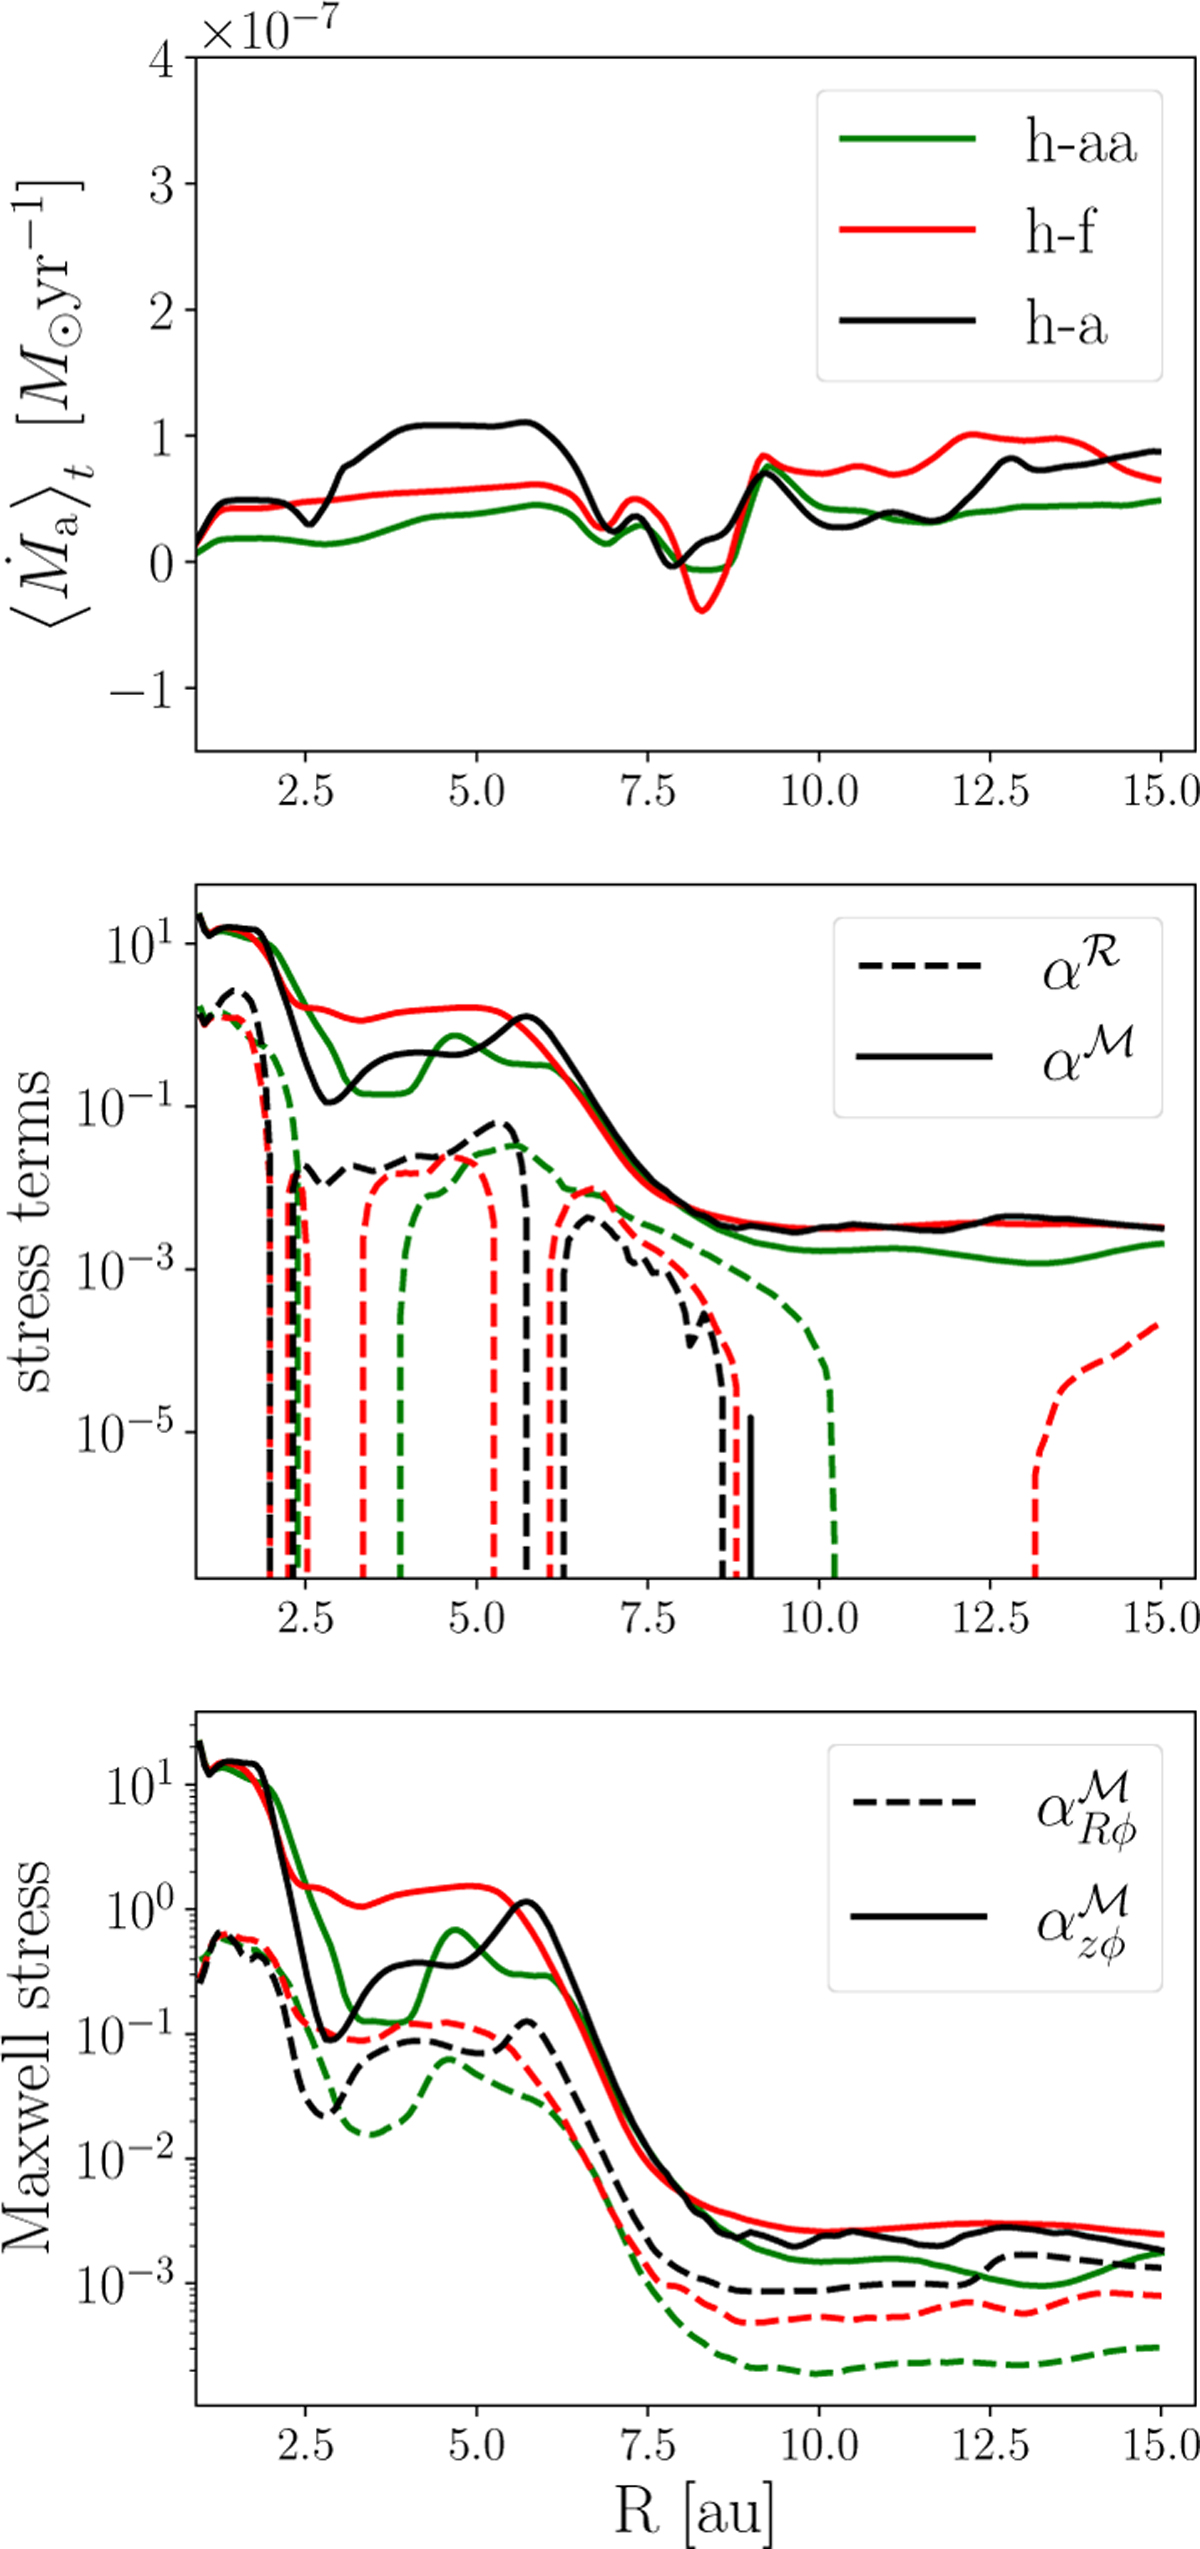
Fig. 3
Download original image
Time-averaged accretion rates and stress terms versus radius for the three runs. In the first panel, we show the measured accretion rates, in the middle panel we show the Reynolds (dashed) vs. the Maxwell stress (solid line), normalized by the vertically integrated pressure. In the bottom panel, we decompose the normalized Maxwell stress into its radial (dashed) and surface (solid line) components.
Current usage metrics show cumulative count of Article Views (full-text article views including HTML views, PDF and ePub downloads, according to the available data) and Abstracts Views on Vision4Press platform.
Data correspond to usage on the plateform after 2015. The current usage metrics is available 48-96 hours after online publication and is updated daily on week days.
Initial download of the metrics may take a while.