Fig. 1
Download original image
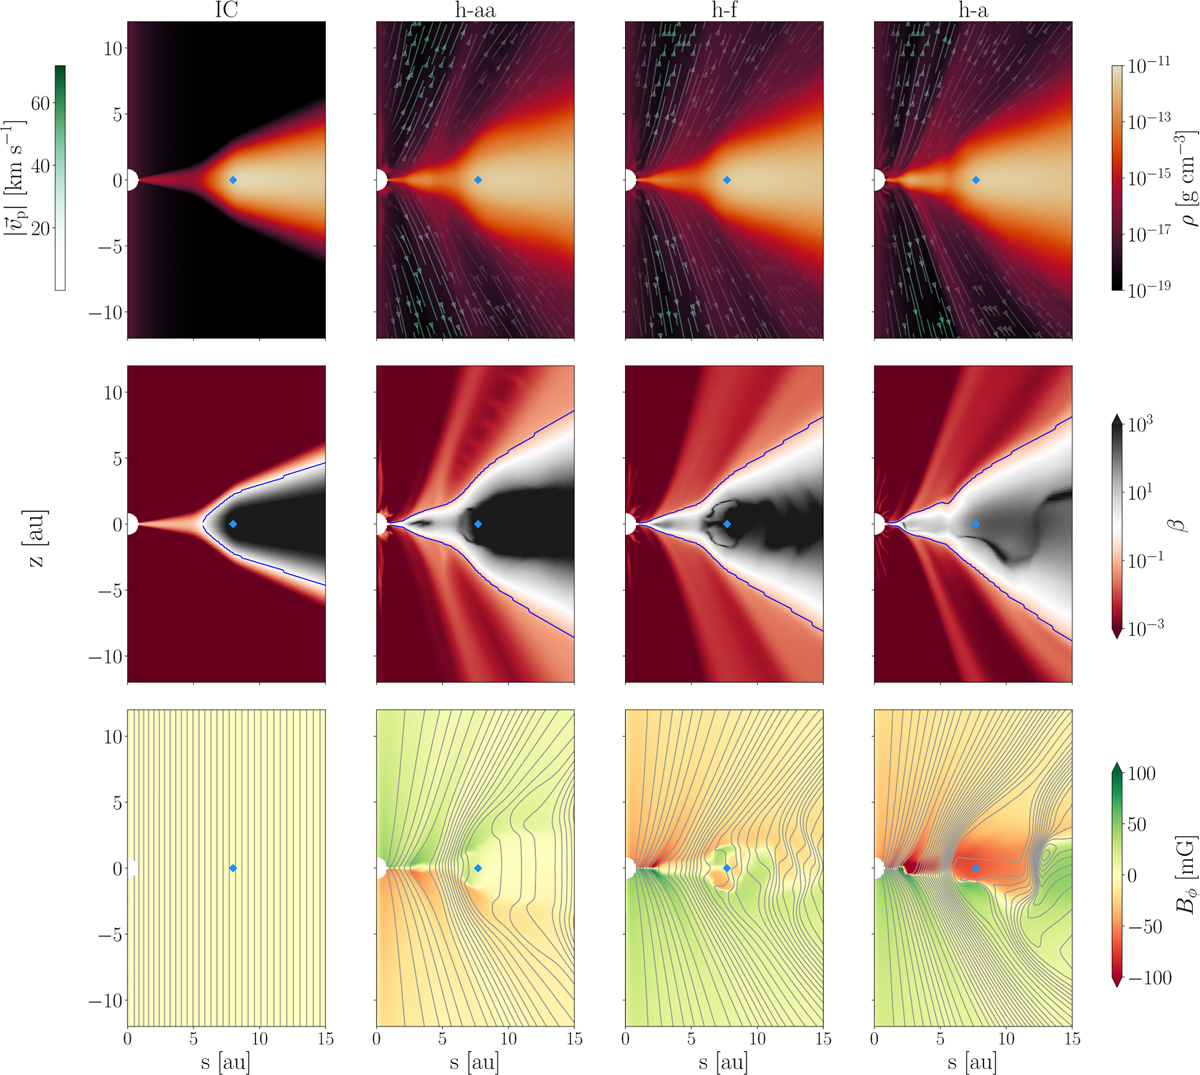
Time-averaged snapshots of the gas density (top row), plasma parameter β (middle row), and toroidal magnetic field (bottom row), for: the initial model (first column), as well as the three runs with Hall anti-aligned (h-aa, second column), Hall free (h-f , third column), and Hall aligned (h-a, fourth column). The streamlines in the first row indicate the poloidal velocity vectors. The blue lines in the middle row are placed where β = 0.1 indicating the vertical integration limits ±zd. Finally, the contour lines in the bottom-row panels highlight the poloidal magnetic field lines. The initial radial location of the cavity edge is marked by a blue diamond in all panels.
Current usage metrics show cumulative count of Article Views (full-text article views including HTML views, PDF and ePub downloads, according to the available data) and Abstracts Views on Vision4Press platform.
Data correspond to usage on the plateform after 2015. The current usage metrics is available 48-96 hours after online publication and is updated daily on week days.
Initial download of the metrics may take a while.