Fig. A.2
Download original image
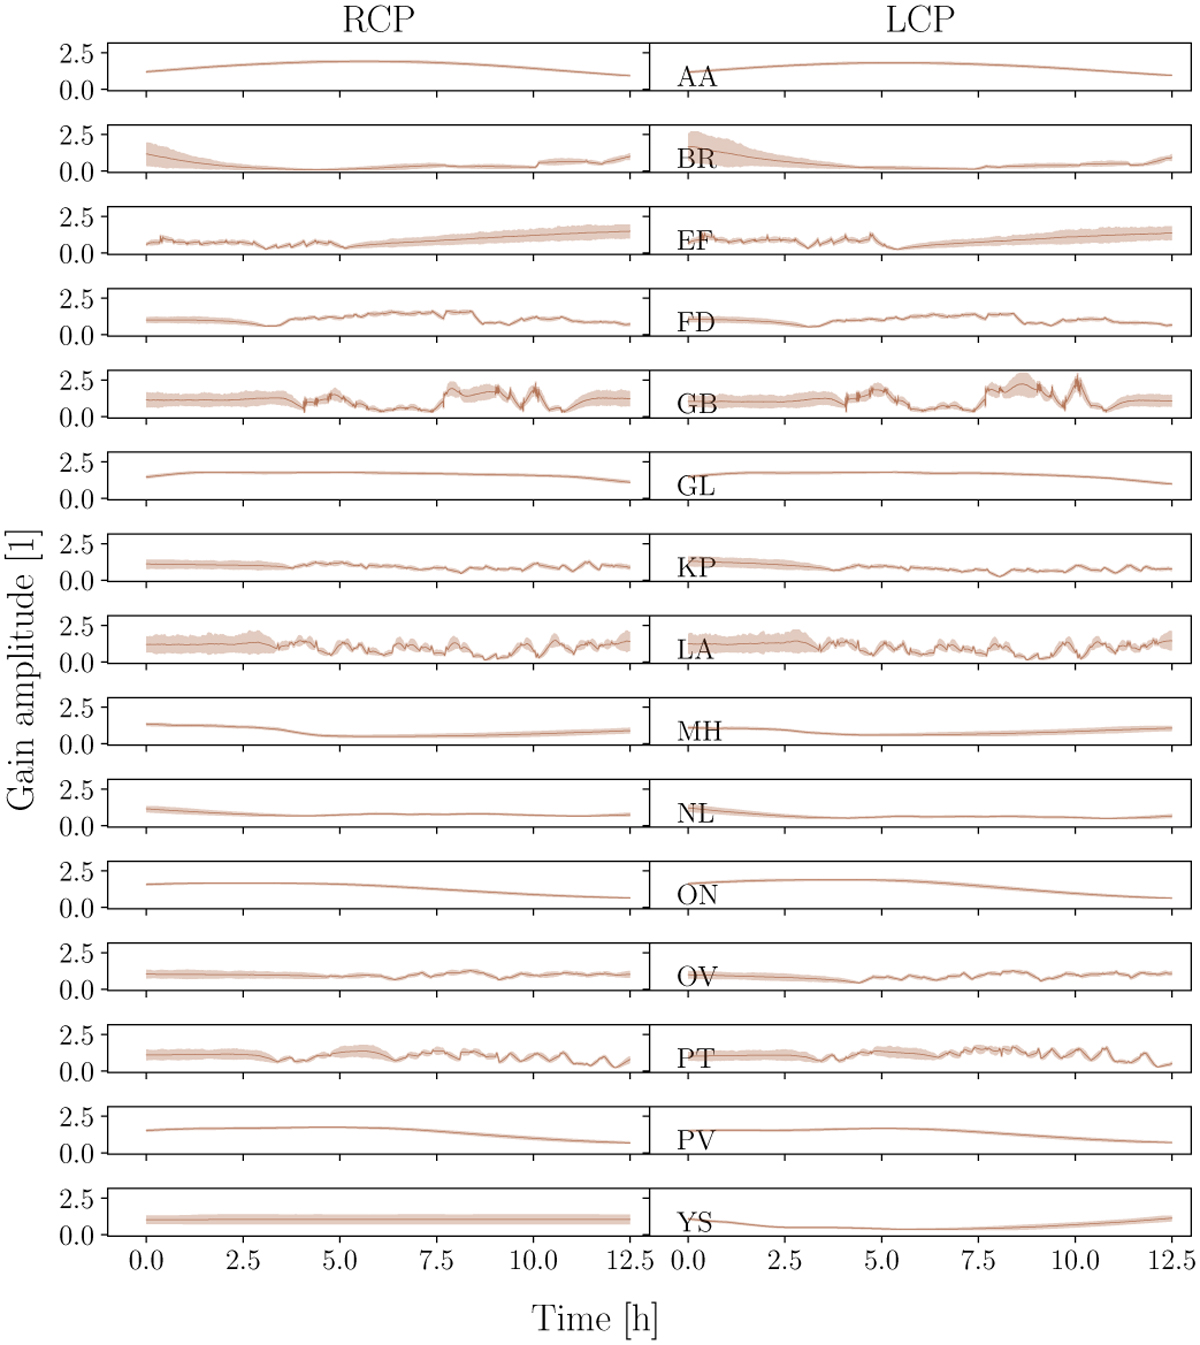
resolve posterior amplitude gains. The gain as a function of time is illustrated as a thin line with a semi-transparent standard deviation. The left and right columns of the figure show gains from the right (RCP) and left (LCP) circular polarizations correspondingly. Each row represents an individual antenna, whose abbreviated name is indicated in the bottom left corner of each LCP plot.
Current usage metrics show cumulative count of Article Views (full-text article views including HTML views, PDF and ePub downloads, according to the available data) and Abstracts Views on Vision4Press platform.
Data correspond to usage on the plateform after 2015. The current usage metrics is available 48-96 hours after online publication and is updated daily on week days.
Initial download of the metrics may take a while.