Fig. 2
Download original image
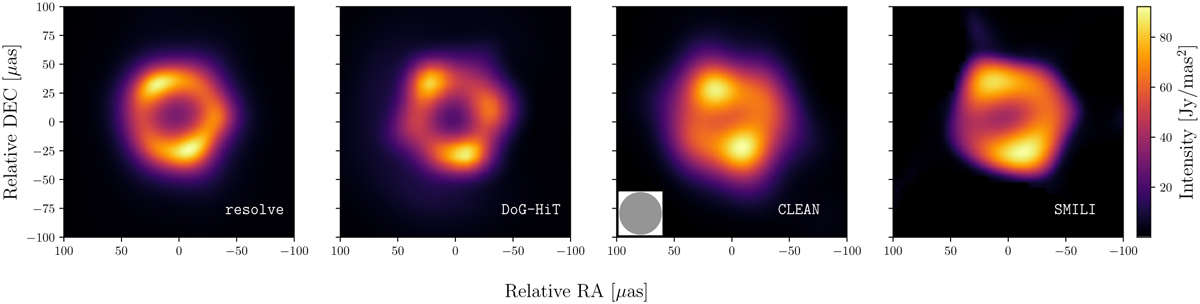
Ring of the M87 image reconstructions at 86 GHz from Fig. 1. The color shows intensity in Jy mas−2 according to the linear color bar located at the right of the figure. Each image presents results obtained by a different algorithm, whose names are indicated in the lower right corners. The left image is the resolve posterior mean image using the Bayesian self-calibration and imaging method. The left-center image is the DoG-HiT reconstruction using closures only imaging. The right-center image represents the CLEAN reconstruction with the over-resolved 37 μas circular beam in Lu et al. (2023). The right image shows the SMILI reconstruction in Lu et al. (2023). All images were processed by a Gaussian interpolation.
Current usage metrics show cumulative count of Article Views (full-text article views including HTML views, PDF and ePub downloads, according to the available data) and Abstracts Views on Vision4Press platform.
Data correspond to usage on the plateform after 2015. The current usage metrics is available 48-96 hours after online publication and is updated daily on week days.
Initial download of the metrics may take a while.