Fig. 6
Download original image
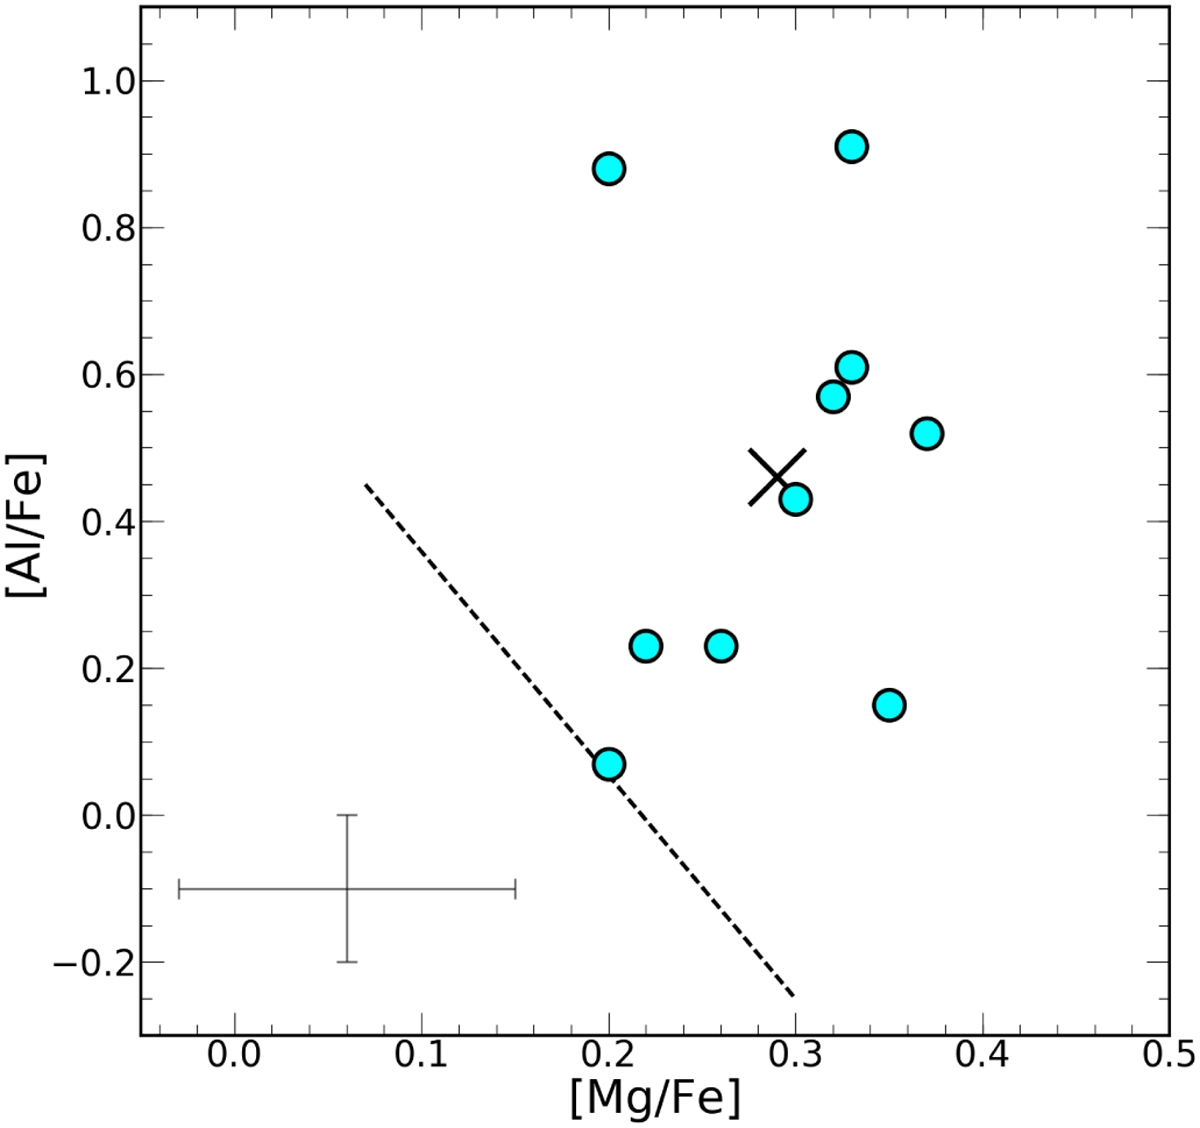
[Mg/Fe] − [Al/Fe] distribution for HP 1 stars (cyan symbols). The black “X” symbol show the average [Mg/Fe] and [Al/Fe] abundance ratios of HP 1 from our BACCHUS values listed in Table 3. The dashed black line taken from Belokurov & Kravtsov (2024) separates the region dominated by in situ GCs (above the line) from accreted GCs (below the line).
Current usage metrics show cumulative count of Article Views (full-text article views including HTML views, PDF and ePub downloads, according to the available data) and Abstracts Views on Vision4Press platform.
Data correspond to usage on the plateform after 2015. The current usage metrics is available 48-96 hours after online publication and is updated daily on week days.
Initial download of the metrics may take a while.